Article: January 29, 2001
- by David LeipThe U.S. Census Bureau has completed the 2000 congressional apportionment. The change in congressional apportionment directly impacts the number of electoral votes allocated to the states affected by the change. The number of electoral votes allocated to each state is equal to the sum of the number of senators (always two) and number of representatives (a minimum of one).
The census and the subsequent apportionment of representatives is performed every ten years because it is required by the U.S. Constitution:
From Amendment XIV, Section 2: (this amendment supersedes some of the original text of Article I, Section 2)
Representatives shall be apportioned among the several States according to their respective numbers,
counting the whole number of persons in each State, excluding Indians not taxed.
From Article I, Section 2:
The actual Enumeration shall be made within three Years after the first Meeting of the Congress of
the United States, and within every subsequent Term of ten Years, in such Manner as they shall by
Law direct. The Number of Representatives shall not exceed one for every thirty Thousand, but each
State shall have at Least one Representative;...
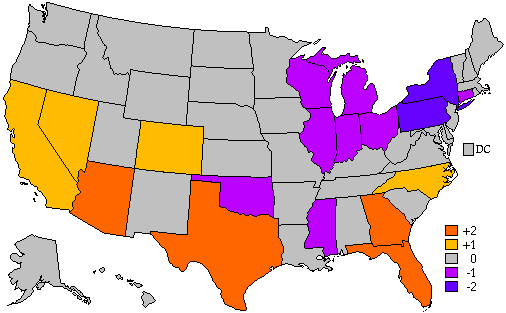
As a result of the 2000 census, eighteen states have a change in the number of electoral votes. Two states, New York and Pennsylvania, lose two votes each. Four states, Arizona, Texas, Georgia, and Florida, gain two votes each. Four additional states gain one vote and eight states lose one vote (see the table and map below). Utah was very close to gaining a seat. The new electoral vote counts shown in the map below are valid for the 2004 and 2008 elections. The next census will be performed in 2010.
If the 2000 election had been held using the new electoral vote allocation,
the result would have been:
Bush 278 - Gore 259 - Abstain 1 vs. the actual result of Bush 271 - Gore
266 - Abstain 1.
More information is available at the U.S. Census Bureau.


