


|
Date of Prediction: 2008-11-03 Version:7
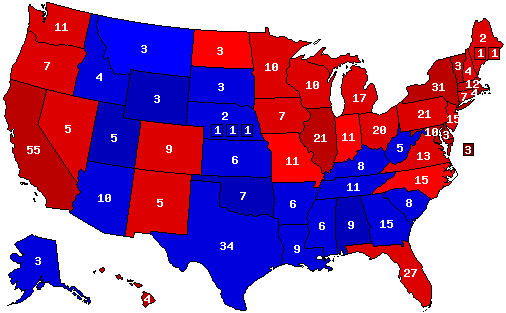
Prediction Map
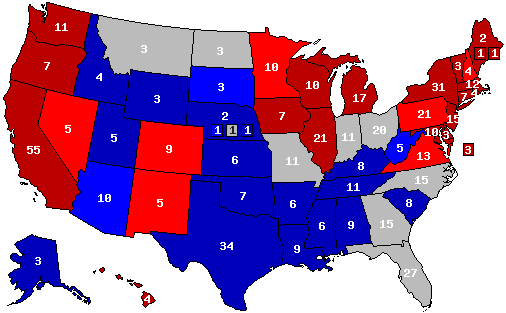
Confidence Map
Prediction States Won
Confidence States Won
State Pick-ups
Prediction Score (max Score = 112)
Analysis
No Analysis Entered
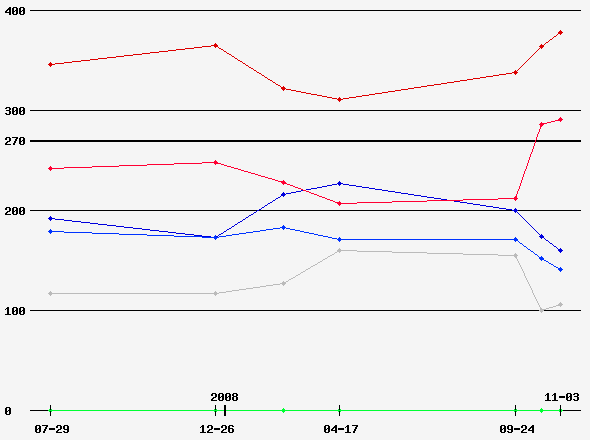
Prediction History
Comments History
- hide
Version: 4 Obama vs McCain Version: 3 Obama vs. McCain
Version History Member Comments User's Predictions
Links
|
|||||||||||||||||||||||||||||||||||||||||||||||||||||||||||||||||||||||||||||||||||||||||||||||||||||||||||||||||||||||||||||||||||||||||||||||||||||||||||||||||||||||||||||||||||||||||||||||||||||||||||||||||||||||||||||||||||||||||||||||||||||||||||||||||||||||||||||||||||||||||||||||||||||||||||||||||||||||||||||||||||||||||||||||||||||||||||||||||||||||||
 2022 Senate
 2022 Governor
 2020 President
 2020 Senate
 2020 Governor
 2016 President
 2016 Senate
 2016 Governor
 2014 Governor
 2013 Governor
 2012 President
 2012 Senate
 2012 Governor
 2010 Senate
 2010 Governor
 2008 President
 2008 Senate
 2008 Governor
 2007 Governor
 2006 U.S. Senate
 2006 Governor
Back to 2008 Presidential Prediction Home - Predictions Home