Note: The Google advertisement links below may advocate political positions that this site does not endorse.
| Map | Pie | Office | Total | D | R | I | Margin | %Margin | Dem | Rep | Ind | Oth. | Dem | Rep | Ind | Other | | | | | | | | | | | | | | | | | | |
|---|
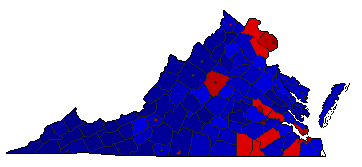
 |  | Governor |
3,289,430 |
2 |
1 |
0 |
63,480 |
1.93% |
48.64% |
50.57% |
0.00% |
0.78% |
1,600,116 |
1,663,596 |
0 |
25,718 |
 |  | Lt. Governor |
3,271,266 |
2 |
1 |
0 |
50,076 |
1.53% |
49.18% |
50.71% |
0.00% |
0.12% |
1,608,691 |
1,658,767 |
0 |
3,808 |
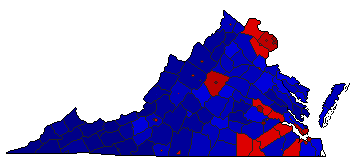 |  | Attorney General |
3,271,757 |
2 |
1 |
0 |
26,307 |
0.80% |
49.55% |
50.36% |
0.00% |
0.09% |
1,621,227 |
1,647,534 |
0 |
2,996 |
|
