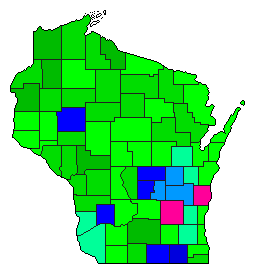
| Map | Pie | Office | Total | D | R | I | Margin | %Margin | Dem | Rep | Ind | Oth. | Dem | Rep | Ind | Other | | | | | | | | | | | | | | | | | | |
|---|
 |  | President |
1,258,560 |
1 |
2 |
- |
422,156 |
33.54% |
63.80% |
30.26% |
0.00% |
5.94% |
802,984 |
380,828 |
0 |
74,748 |
 | | Governor |
1,236,907 |
3 |
2 |
1 |
209,751 |
16.96% |
21.71% |
29.43% |
46.38% |
2.48% |
268,530 |
363,973 |
573,724 |
30,680 |
 |  | Lt. Governor |
1,117,798 |
3 |
2 |
1 |
110,578 |
9.89% |
25.94% |
31.79% |
41.68% |
0.59% |
289,964 |
355,340 |
465,918 |
6,576 |
 |  | Secretary of State |
1,154,437 |
3 |
2 |
1 |
301,612 |
26.13% |
21.45% |
25.99% |
52.12% |
0.45% |
247,592 |
300,026 |
601,638 |
5,181 |
 |  | State Treasurer |
1,144,132 |
2 |
3 |
1 |
83,797 |
7.32% |
32.70% |
26.80% |
40.03% |
0.47% |
374,145 |
306,632 |
457,942 |
5,413 |
 |  | Attorney General |
1,092,221 |
2 |
3 |
1 |
40,610 |
3.72% |
32.38% |
31.08% |
36.10% |
0.44% |
353,642 |
339,502 |
394,252 |
4,825 |
|