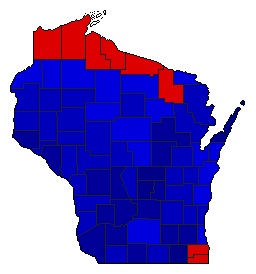
| Map | Pie | Office | Total | D | R | I | Margin | %Margin | Dem | Rep | Ind | Oth. | Dem | Rep | Ind | Other | | | | | | | | | | | | | | | | | | |
|---|
 |  | Senator |
1,012,504 |
2 |
1 |
3 |
241,658 |
23.87% |
37.41% |
61.28% |
1.16% |
0.15% |
378,772 |
620,430 |
11,750 |
1,552 |
 | | Governor |
1,040,444 |
2 |
1 |
3 |
215,471 |
20.71% |
39.07% |
59.78% |
0.86% |
0.29% |
406,499 |
621,970 |
8,996 |
2,979 |
 |  | Lt. Governor |
989,585 |
2 |
1 |
3 |
231,316 |
23.38% |
37.67% |
61.04% |
1.28% |
0.01% |
372,738 |
604,054 |
12,699 |
94 |
 |  | Secretary of State |
1,001,921 |
2 |
1 |
3 |
374,068 |
37.34% |
30.70% |
68.04% |
1.26% |
0.01% |
307,591 |
681,659 |
12,580 |
91 |
 |  | State Treasurer |
982,353 |
2 |
1 |
3 |
362,020 |
36.85% |
30.78% |
67.63% |
1.58% |
0.01% |
302,375 |
664,395 |
15,513 |
70 |
 |  | Attorney General |
975,743 |
2 |
1 |
3 |
402,446 |
41.25% |
28.71% |
69.96% |
1.32% |
0.01% |
280,145 |
682,591 |
12,919 |
88 |
|