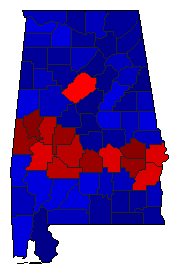
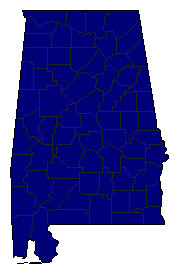
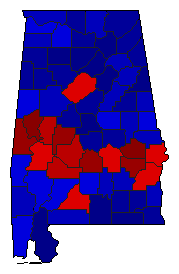
| Map | Pie | Office | Total | D | R | I | Margin | %Margin | Dem | Rep | Ind | Oth. | Dem | Rep | Ind | Other | | | | | | | | | | | | | | | | | | |
|---|
 |  | Senator |
818,090 |
0 |
1 |
0 |
773,122 |
94.50% |
0.00% |
97.25% |
0.00% |
2.75% |
0 |
795,606 |
0 |
22,484 |
 |  | Governor |
1,180,413 |
2 |
1 |
0 |
322,444 |
27.32% |
36.24% |
63.56% |
0.00% |
0.20% |
427,787 |
750,231 |
0 |
2,395 |
 | | Lt. Governor |
1,167,243 |
2 |
1 |
0 |
310,083 |
26.57% |
36.67% |
63.23% |
0.00% |
0.10% |
428,007 |
738,090 |
0 |
1,146 |
 | | Secretary of State |
1,140,942 |
2 |
1 |
0 |
326,925 |
28.65% |
35.62% |
64.27% |
0.00% |
0.11% |
406,373 |
733,298 |
0 |
1,271 |
 | | State Treasurer |
764,100 |
0 |
1 |
0 |
733,652 |
96.02% |
0.00% |
98.01% |
0.00% |
1.99% |
0 |
748,876 |
0 |
15,224 |
 | | Attorney General |
1,167,901 |
2 |
1 |
0 |
198,202 |
16.97% |
41.42% |
58.39% |
0.00% |
0.18% |
483,771 |
681,973 |
0 |
2,157 |
 | | State Auditor |
1,137,975 |
2 |
1 |
0 |
295,279 |
25.95% |
36.98% |
62.93% |
0.00% |
0.09% |
420,843 |
716,122 |
0 |
1,010 |
 | | Agriculture Commissioner |
1,135,697 |
2 |
1 |
0 |
334,129 |
29.42% |
35.25% |
64.67% |
0.00% |
0.09% |
400,299 |
734,428 |
0 |
970 |
|