| Map | Pie | Office | Total | D | R | I | Margin | %Margin | Dem | Rep | Ind | Oth. | Dem | Rep | Ind | Other | | | | | | | | | | | | | | | | | | |
|---|
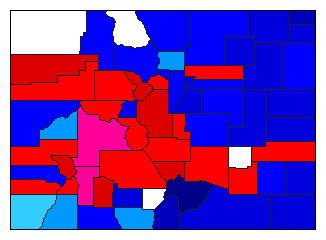 |  | Governor |
203,134 |
2 |
1 |
3 |
18,186 |
8.95% |
36.63% |
45.59% |
8.87% |
8.91% |
74,416 |
92,602 |
18,014 |
18,102 |
 |  | Lt. Governor |
196,448 |
2 |
1 |
3 |
22,517 |
11.46% |
39.71% |
51.17% |
6.87% |
2.25% |
78,001 |
100,518 |
13,501 |
4,428 |
 |  | Secretary of State |
196,470 |
2 |
1 |
3 |
24,027 |
12.23% |
39.41% |
51.64% |
6.70% |
2.25% |
77,434 |
101,461 |
13,158 |
4,417 |
 |  | State Treasurer |
196,368 |
2 |
1 |
3 |
25,782 |
13.13% |
39.11% |
52.24% |
6.56% |
2.10% |
76,793 |
102,575 |
12,875 |
4,125 |
 |  | Attorney General |
195,989 |
2 |
1 |
3 |
24,732 |
12.62% |
39.36% |
51.98% |
6.48% |
2.18% |
77,134 |
101,866 |
12,708 |
4,281 |
 |  | State Auditor |
196,384 |
2 |
1 |
3 |
25,613 |
13.04% |
39.07% |
52.12% |
6.63% |
2.18% |
76,735 |
102,348 |
13,020 |
4,281 |
|
