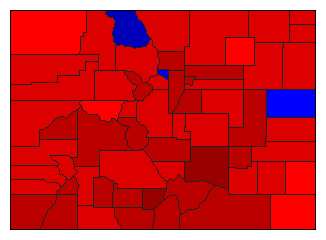
| Map | Pie | Office | Total | D | R | I | Margin | %Margin | Dem | Rep | Ind | Oth. | Dem | Rep | Ind | Other | | | | | | | | | | | | | | | | | | |
|---|
 |  | Senator |
297,695 |
2 |
1 |
3 |
11,472 |
3.85% |
46.39% |
50.25% |
1.96% |
1.40% |
138,113 |
149,585 |
5,829 |
4,168 |
 |  | Governor |
306,402 |
1 |
2 |
3 |
66,586 |
21.73% |
59.84% |
38.11% |
1.28% |
0.78% |
183,342 |
116,756 |
3,919 |
2,385 |
 |  | Lt. Governor |
286,170 |
2 |
1 |
3 |
9,089 |
3.18% |
46.34% |
49.52% |
2.35% |
1.79% |
132,613 |
141,702 |
6,731 |
5,124 |
 |  | Secretary of State |
288,551 |
2 |
1 |
3 |
22,740 |
7.88% |
44.28% |
52.16% |
2.16% |
1.39% |
127,780 |
150,520 |
6,245 |
4,006 |
 |  | State Treasurer |
287,649 |
2 |
1 |
3 |
16,386 |
5.70% |
45.27% |
50.97% |
2.17% |
1.59% |
130,224 |
146,610 |
6,246 |
4,569 |
 |  | Attorney General |
282,337 |
2 |
1 |
3 |
38,305 |
13.57% |
41.63% |
55.19% |
2.12% |
1.06% |
117,529 |
155,834 |
5,987 |
2,987 |
 |  | State Auditor |
285,280 |
2 |
1 |
3 |
16,529 |
5.79% |
44.94% |
50.73% |
2.93% |
1.40% |
128,197 |
144,726 |
8,369 |
3,988 |
|