| Map | Pie | Office | Total | D | R | I | Margin | %Margin | Dem | Rep | Ind | Oth. | Dem | Rep | Ind | Other | | | | | | | | | | | | | | | | | | |
|---|
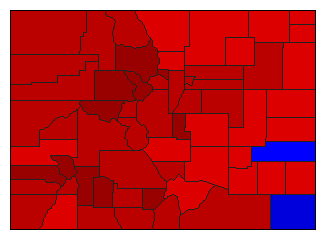
 |  | President |
392,242 |
2 |
1 |
- |
120,741 |
30.78% |
33.94% |
64.72% |
0.00% |
1.34% |
133,131 |
253,872 |
0 |
5,239 |
 |  | Governor |
388,265 |
1 |
2 |
3 |
95,993 |
24.72% |
61.85% |
37.13% |
0.48% |
0.53% |
240,160 |
144,167 |
1,873 |
2,065 |
 |  | Lt. Governor |
370,292 |
2 |
1 |
3 |
43,064 |
11.63% |
42.88% |
54.51% |
0.99% |
1.61% |
158,798 |
201,862 |
3,684 |
5,948 |
 |  | Secretary of State |
361,292 |
2 |
1 |
3 |
109,968 |
30.44% |
34.05% |
64.48% |
0.80% |
0.67% |
123,009 |
232,977 |
2,903 |
2,403 |
 |  | State Treasurer |
362,648 |
2 |
1 |
3 |
78,244 |
21.58% |
37.84% |
59.42% |
1.36% |
1.39% |
137,227 |
215,471 |
4,915 |
5,035 |
 |  | Attorney General |
351,690 |
2 |
1 |
3 |
65,576 |
18.65% |
39.42% |
58.07% |
2.51% |
0.00% |
138,636 |
204,212 |
8,842 |
0 |
 |  | State Auditor |
362,420 |
2 |
1 |
3 |
46,105 |
12.72% |
42.49% |
55.21% |
1.33% |
0.98% |
153,985 |
200,090 |
4,804 |
3,541 |
|
