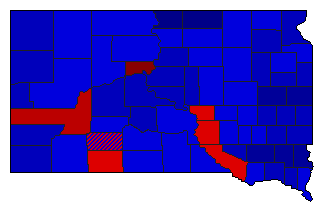
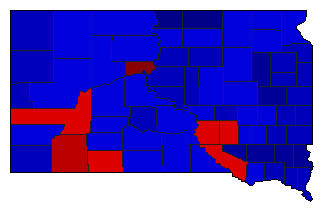
| Map | Pie | Office | Total | D | R | I | Margin | %Margin | Dem | Rep | Ind | Oth. | Dem | Rep | Ind | Other | | | | | | | | | | | | | | | | | | |
|---|
 |  | Senator |
251,362 |
2 |
1 |
0 |
69,978 |
27.84% |
36.08% |
63.92% |
0.00% |
0.00% |
90,692 |
160,670 |
0 |
0 |
 |  | Governor |
253,316 |
2 |
1 |
0 |
55,192 |
21.79% |
39.11% |
60.89% |
0.00% |
0.00% |
99,062 |
154,254 |
0 |
0 |
 |  | Lt. Governor |
242,914 |
2 |
1 |
0 |
55,346 |
22.78% |
38.61% |
61.39% |
0.00% |
0.00% |
93,784 |
149,130 |
0 |
0 |
 |  | Secretary of State |
242,712 |
2 |
1 |
0 |
47,162 |
19.43% |
40.28% |
59.72% |
0.00% |
0.00% |
97,775 |
144,937 |
0 |
0 |
 |  | State Treasurer |
241,623 |
2 |
1 |
0 |
39,537 |
16.36% |
41.82% |
58.18% |
0.00% |
0.00% |
101,043 |
140,580 |
0 |
0 |
 |  | Attorney General |
242,486 |
2 |
1 |
0 |
46,902 |
19.34% |
40.33% |
59.67% |
0.00% |
0.00% |
97,792 |
144,694 |
0 |
0 |
 |  | State Auditor |
240,976 |
2 |
1 |
0 |
54,886 |
22.78% |
38.61% |
61.39% |
0.00% |
0.00% |
93,045 |
147,931 |
0 |
0 |
|


