1960 General Election Results Comparison - Pennsylvania
| Map | Pie | Office | Total | D | R | I | Margin | %Margin | Dem | Rep | Ind | Oth. | Dem | Rep | Ind | Other |
 |  | President | 5,006,541 | 1 | 2 | 0 | 116,326 | 2.32% | 51.06% | 48.74% | 0.00% | 0.21% | 2,556,282 | 2,439,956 | 0 | 10,303 |
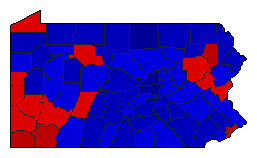 |  | State Treasurer | 4,921,359 | 1 | 2 | 0 | 116,171 | 2.36% | 51.04% | 48.68% | 0.00% | 0.28% | 2,511,941 | 2,395,770 | 0 | 13,648 |
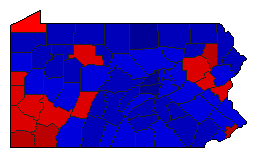 |  | State Auditor | 4,928,361 | 1 | 2 | 0 | 145,562 | 2.95% | 51.31% | 48.36% | 0.00% | 0.33% | 2,528,740 | 2,383,178 | 0 | 16,443 |
Pennsylvania Results for 1960
Login
© Dave Leip's Atlas of U.S. Elections, LLC 2019 All Rights Reserved
Note: The advertisement links below may advocate political positions that this site does not endorse.
Login
© Dave Leip's Atlas of U.S. Elections, LLC 2019 All Rights Reserved
Note: The advertisement links below may advocate political positions that this site does not endorse.