Note: The Google advertisement links below may advocate political positions that this site does not endorse.
| Map | Pie | Office | Total | D | R | I | Margin | %Margin | Dem | Rep | Ind | Oth. | Dem | Rep | Ind | Other | | | | | | | | | | | | | | | | | | |
|---|
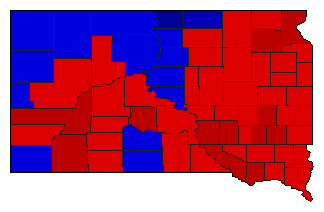 |  | Governor |
239,963 |
1 |
2 |
0 |
23,269 |
9.70% |
54.85% |
45.15% |
0.00% |
0.00% |
131,616 |
108,347 |
0 |
0 |
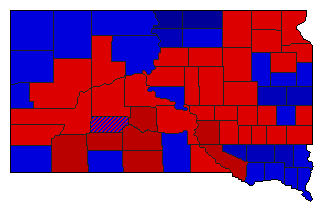
 |  | Lt. Governor |
233,306 |
1 |
2 |
0 |
2,404 |
1.03% |
50.52% |
49.48% |
0.00% |
0.00% |
117,855 |
115,451 |
0 |
0 |
 |  | Secretary of State |
232,850 |
2 |
1 |
0 |
39,338 |
16.89% |
41.55% |
58.45% |
0.00% |
0.00% |
96,756 |
136,094 |
0 |
0 |
 |  | State Treasurer |
228,601 |
2 |
1 |
0 |
19,639 |
8.59% |
45.70% |
54.30% |
0.00% |
0.00% |
104,481 |
124,120 |
0 |
0 |
 |  | Attorney General |
231,126 |
2 |
1 |
0 |
1,860 |
0.80% |
49.60% |
50.40% |
0.00% |
0.00% |
114,633 |
116,493 |
0 |
0 |
 |  | State Auditor |
228,997 |
2 |
1 |
0 |
3,911 |
1.71% |
49.15% |
50.85% |
0.00% |
0.00% |
112,543 |
116,454 |
0 |
0 |
|
