1986 General Election Results Comparison - Washington
| Map | Pie | Office | Total | D | R | I | Margin | %Margin | Dem | Rep | Ind | Oth. | Dem | Rep | Ind | Other |
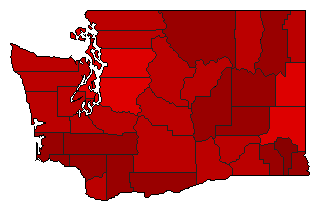
 | Senator | 1,337,367 | 1 | 2 | 0 | 26,540 | 1.98% | 50.66% | 48.67% | 0.00% | 0.67% | 677,471 | 650,931 | 0 | 8,965 | |
| Map | Pie | Initiative | Total Vote | N | Y | Margin | %Margin | No | Yes | Oth. | No | Yes | ||||
 | Referendum | 1,278,037 | 2 | 0 | 1 | 833,755 | 65.24% | 17.38% | 0.00% | 82.62% | 0.00% | 222,141 | 0 | 1,055,896 | 0 | |
 | Initiative | 1,278,176 | 1 | 0 | 2 | 290,588 | 22.73% | 61.37% | 0.00% | 38.63% | 0.00% | 784,382 | 0 | 493,794 | 0 | |
Washington Results for 1986
Login
© Dave Leip's Atlas of U.S. Elections, LLC 2019 All Rights Reserved
Note: The advertisement links below may advocate political positions that this site does not endorse.
Login
© Dave Leip's Atlas of U.S. Elections, LLC 2019 All Rights Reserved
Note: The advertisement links below may advocate political positions that this site does not endorse.