1992 General Election Results Comparison - Pennsylvania
| Map | Pie | Office | Total | D | R | I | Margin | %Margin | Dem | Rep | Ind | Oth. | Dem | Rep | Ind | Other |
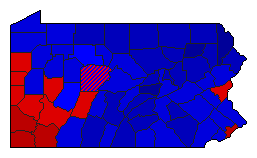
 |  | President | 4,959,810 | 1 | 2 | 3 | 447,323 | 9.02% | 45.15% | 36.13% | 18.20% | 0.53% | 2,239,164 | 1,791,841 | 902,667 | 26,138 |
 |  | Senator | 4,802,410 | 2 | 1 | 0 | 133,159 | 2.77% | 46.33% | 49.10% | 0.00% | 4.57% | 2,224,966 | 2,358,125 | 0 | 219,319 |
 |  | Attorney General | 4,594,077 | 2 | 1 | 0 | 125,605 | 2.73% | 47.62% | 50.36% | 0.00% | 2.02% | 2,187,792 | 2,313,397 | 0 | 92,888 |
Pennsylvania Results for 1992
Login
© Dave Leip's Atlas of U.S. Elections, LLC 2019 All Rights Reserved
Note: The advertisement links below may advocate political positions that this site does not endorse.
Login
© Dave Leip's Atlas of U.S. Elections, LLC 2019 All Rights Reserved
Note: The advertisement links below may advocate political positions that this site does not endorse.