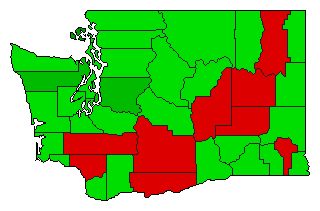
1998 General Election Results Comparison - Washington
| Map | Pie | Office | Total | D | R | I | Margin | %Margin | Dem | Rep | Ind | Oth. | Dem | Rep | Ind | Other |
 |  | Senator | 1,888,561 | 1 | 2 | 0 | 317,807 | 16.83% | 58.41% | 41.59% | 0.00% | 0.00% | 1,103,184 | 785,377 | 0 | 0 |
| Map | Pie | Initiative | Total Vote | N | Y | Margin | %Margin | No | Yes | Oth. | No | Yes | ||||
 | Initiative | 1,904,234 | 2 | 0 | 1 | 614,706 | 32.28% | 33.86% | 0.00% | 66.14% | 0.00% | 644,764 | 0 | 1,259,470 | 0 | |
 | Initiative | 1,902,482 | 2 | 0 | 1 | 341,220 | 17.94% | 41.03% | 0.00% | 58.97% | 0.00% | 780,631 | 0 | 1,121,851 | 0 | |
 | Initiative | 1,872,736 | 1 | 0 | 2 | 267,984 | 14.31% | 57.15% | 0.00% | 42.85% | 0.00% | 1,070,360 | 0 | 802,376 | 0 | |
Washington Results for 1998
Login
© Dave Leip's Atlas of U.S. Elections, LLC 2019 All Rights Reserved
Note: The advertisement links below may advocate political positions that this site does not endorse.
Login
© Dave Leip's Atlas of U.S. Elections, LLC 2019 All Rights Reserved
Note: The advertisement links below may advocate political positions that this site does not endorse.