2004 General Election Results Comparison - Ohio
| Map | Pie | Office | Total | D | R | I | Margin | %Margin | Dem | Rep | Ind | Oth. | Dem | Rep | Ind | Other |
 |  | President | 5,627,908 | 2 | 1 | - | 118,601 | 2.11% | 48.71% | 50.81% | 0.00% | 0.48% | 2,741,167 | 2,859,768 | 0 | 26,973 |
 |  | Senator | 5,426,196 | 2 | 1 | 0 | 1,503,402 | 27.71% | 36.14% | 63.85% | 0.00% | 0.01% | 1,961,249 | 3,464,651 | 0 | 296 |
| Map | Pie | Initiative | Total Vote | N | Y | Margin | %Margin | No | Yes | Oth. | No | Yes | ||||
 | Initiative | 5,394,797 | 2 | 0 | 1 | 1,263,873 | 23.43% | 38.29% | 0.00% | 61.71% | 0.00% | 2,065,462 | 0 | 3,329,335 | 0 | |
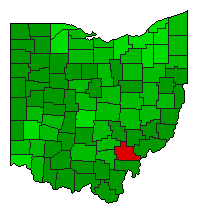
Ohio Results for 2004
Login
© Dave Leip's Atlas of U.S. Elections, LLC 2019 All Rights Reserved
Note: The advertisement links below may advocate political positions that this site does not endorse.
Login
© Dave Leip's Atlas of U.S. Elections, LLC 2019 All Rights Reserved
Note: The advertisement links below may advocate political positions that this site does not endorse.