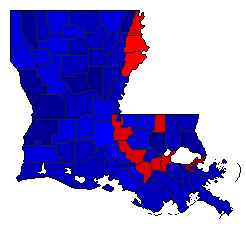
2004 Presidential General Election Data - Louisiana
Note: The Google advertisement links below may advocate political positions that this site does not endorse.
by Parish

 County Map  
ParishTotal REGTotal Vote%REG
    
Acadia38,42025,23065.7%
Allen13,7409,12466.4%
Ascension54,10339,10072.3%
Assumption15,67510,73568.5%
Avoyelles25,72215,52560.4%
Beauregard20,56413,28164.6%
Bienville10,1157,15770.8%
Bossier64,10142,70566.6%
Caddo160,078106,59566.6%
Calcasieu124,89279,69863.8%
Caldwell7,1744,75266.2%
Cameron7,5094,64061.8%
Catahoula7,8334,95463.2%
Claiborne9,4126,63070.4%
Concordia13,6618,98065.7%
De Soto17,05111,33666.5%
East Baton Rouge262,784183,64269.9%
East Carroll6,1843,39554.9%
East Feliciana13,4909,20168.2%
Evangeline22,77313,97961.4%
Franklin13,8339,10365.8%
Grant12,5027,99163.9%
Iberia47,34332,27368.2%
Iberville21,20214,82769.9%
Jackson10,7577,64771.1%
Jefferson287,300191,66366.7%
Jefferson Davis20,46313,00763.6%
Lafayette130,68389,92368.8%
Lafourche55,40737,86468.3%
La Salle9,0696,23868.8%
Lincoln27,69318,21865.8%
Livingston65,82044,25367.2%
Madison8,7114,67353.6%
Morehouse20,79712,97162.4%
Natchitoches26,25916,96664.6%
Orleans320,253197,10361.5%
Ouachita99,06464,44465.1%
Plaquemines18,01912,15367.4%
Pointe Coupee16,41111,27168.7%
Rapides81,27354,06966.5%
Red River6,6614,71770.8%
Richland13,6688,66563.4%
Sabine15,2069,57663.0%
St. Bernard43,88929,83868.0%
St. Charles32,47623,83773.4%
St. Helena8,6655,50863.6%
St. James14,79211,10875.1%
St. John the Baptist28,46519,61768.9%
St. Landry56,38936,76065.2%
St. Martin33,79522,82467.5%
St. Mary34,94322,69464.9%
St. Tammany142,831100,59270.4%
Tangipahoa65,55142,13564.3%
Tensas4,8272,96361.4%
Terrebonne61,71140,57465.7%
Union15,89010,71867.5%
Vermilion36,56624,55267.1%
Vernon24,20315,22962.9%
Washington27,45117,84165.0%
Webster27,47918,44967.1%
West Baton Rouge14,77010,83573.4%
West Carroll8,0055,03362.9%
West Feliciana7,1205,21873.3%
Winn9,9026,50765.7%
Total2,923,3951,943,10666.5%
Enable

Purchase Data in Spreadsheet

Customize Table:
Enable Columns Not Shown
Population
Voting Age Population
Voting Age Citizens
Total Ballots Cast
Total Invalid Ballots (Under/Over-Votes)
Percent Invalid Ballots (Under/Over-Votes)
Voter Turnout (Vote for President as a % Voting Age Population)
Voter Turnout (Vote for President as a % Voting Age Citizens)
Candidate Rank
Margin
Swing Percentage
Trend Percentage
Popular Vote Percentage
Popular Vote

Minimum Candidate Percentage to Display Individual Percent Column (m)
Minimum Candidate Percentage to Display Individual Popular Vote Column (m)

Sort Data:

Sort Direction: Ascending Descending


Sources:
  • Source for Registered Voters Parish data: Louisiana Department of Elections and Registration. Statewide Post Election Statistical Report for Election of 11/02/2004 (Active & Inactive), Louisiana Department of Elections and Registration (http://) (accessed 07 Dec 2004)

2004 National Turnout Data Table by State - Louisiana Results for 2004

Login

Terms of Use - DCMA Policy - Privacy Policy and Cookies


© Dave Leip's Atlas of U.S. Elections, LLC 2019 All Rights Reserved