1998 Senatorial General Election Data Graphs - North Carolina
Note: The Google advertisement links below may advocate political positions that this site does not endorse.
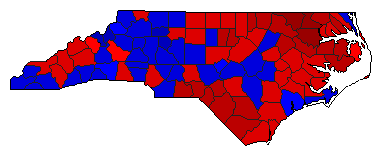
Map

AlamanceEdwards45.5%
 
Faircloth52.6%
 
Other1.9%


AlexanderEdwards43.9%
 
Faircloth53.7%
 
Other2.4%


AlleghanyEdwards53.7%
 
Faircloth43.9%
 
Other2.4%


AnsonEdwards70.0%
 
Faircloth28.5%
 
Other1.5%


AsheEdwards46.2%
 
Faircloth51.0%
 
Other2.8%


AveryEdwards27.4%
 
Faircloth67.5%
 
Other5.2%


BeaufortEdwards50.9%
 
Faircloth47.0%
 
Other2.1%


BertieEdwards70.4%
 
Faircloth28.8%
 
Other0.8%


BladenEdwards64.4%
 
Faircloth34.6%
 
Other1.0%


BrunswickEdwards55.6%
 
Faircloth42.2%
 
Other2.2%


BuncombeEdwards52.1%
 
Faircloth46.2%
 
Other1.7%


BurkeEdwards49.9%
 
Faircloth47.7%
 
Other2.4%


CabarrusEdwards45.2%
 
Faircloth52.2%
 
Other2.6%


CaldwellEdwards43.6%
 
Faircloth54.0%
 
Other2.3%


CamdenEdwards52.7%
 
Faircloth45.7%
 
Other1.5%


CarteretEdwards46.7%
 
Faircloth50.9%
 
Other2.4%


CaswellEdwards59.3%
 
Faircloth39.8%
 
Other0.9%


CatawbaEdwards39.1%
 
Faircloth58.2%
 
Other2.7%


ChathamEdwards58.1%
 
Faircloth40.4%
 
Other1.4%


CherokeeEdwards43.9%
 
Faircloth52.4%
 
Other3.7%


ChowanEdwards56.3%
 
Faircloth40.9%
 
Other2.8%


ClayEdwards44.7%
 
Faircloth53.3%
 
Other2.0%


ClevelandEdwards52.1%
 
Faircloth45.1%
 
Other2.7%


ColumbusEdwards64.0%
 
Faircloth34.4%
 
Other1.6%


CravenEdwards51.5%
 
Faircloth46.5%
 
Other2.0%


CumberlandEdwards55.5%
 
Faircloth43.0%
 
Other1.5%


CurrituckEdwards46.6%
 
Faircloth51.3%
 
Other2.1%


DareEdwards49.9%
 
Faircloth47.4%
 
Other2.8%


DavidsonEdwards44.3%
 
Faircloth53.5%
 
Other2.2%


DavieEdwards35.7%
 
Faircloth61.9%
 
Other2.4%


DuplinEdwards54.0%
 
Faircloth44.4%
 
Other1.6%


DurhamEdwards66.1%
 
Faircloth32.7%
 
Other1.2%


EdgecombeEdwards66.3%
 
Faircloth33.0%
 
Other0.8%


ForsythEdwards50.9%
 
Faircloth47.7%
 
Other1.4%


FranklinEdwards51.9%
 
Faircloth46.6%
 
Other1.5%


GastonEdwards41.9%
 
Faircloth55.5%
 
Other2.7%


GatesEdwards65.7%
 
Faircloth33.2%
 
Other1.2%


GrahamEdwards40.8%
 
Faircloth57.2%
 
Other1.9%


GranvilleEdwards56.7%
 
Faircloth42.0%
 
Other1.3%


GreeneEdwards52.1%
 
Faircloth47.0%
 
Other0.9%


GuilfordEdwards55.1%
 
Faircloth43.3%
 
Other1.6%


HalifaxEdwards64.3%
 
Faircloth34.9%
 
Other0.8%


HarnettEdwards45.0%
 
Faircloth53.7%
 
Other1.2%


HaywoodEdwards54.8%
 
Faircloth43.4%
 
Other1.8%


HendersonEdwards38.6%
 
Faircloth59.7%
 
Other1.8%


HertfordEdwards70.1%
 
Faircloth28.9%
 
Other1.1%


HokeEdwards65.2%
 
Faircloth32.3%
 
Other2.5%


HydeEdwards61.2%
 
Faircloth36.8%
 
Other2.0%


IredellEdwards42.8%
 
Faircloth54.6%
 
Other2.6%


JacksonEdwards57.7%
 
Faircloth40.5%
 
Other1.9%


JohnstonEdwards39.1%
 
Faircloth59.5%
 
Other1.4%


JonesEdwards58.0%
 
Faircloth40.3%
 
Other1.6%


LeeEdwards49.2%
 
Faircloth49.5%
 
Other1.3%


LenoirEdwards52.9%
 
Faircloth46.1%
 
Other1.0%


LincolnEdwards46.0%
 
Faircloth51.2%
 
Other2.9%


McDowellEdwards46.1%
 
Faircloth51.4%
 
Other2.5%


MaconEdwards46.3%
 
Faircloth51.4%
 
Other2.3%


MadisonEdwards55.2%
 
Faircloth43.3%
 
Other1.6%


MartinEdwards61.2%
 
Faircloth37.6%
 
Other1.1%


MecklenburgEdwards54.2%
 
Faircloth43.7%
 
Other2.1%


MitchellEdwards29.3%
 
Faircloth68.5%
 
Other2.1%


MontgomeryEdwards57.1%
 
Faircloth40.7%
 
Other2.2%


MooreEdwards45.4%
 
Faircloth53.6%
 
Other1.0%


NashEdwards44.4%
 
Faircloth54.5%
 
Other1.1%


New HanoverEdwards52.4%
 
Faircloth45.1%
 
Other2.5%


NorthamptonEdwards73.8%
 
Faircloth25.6%
 
Other0.6%


OnslowEdwards48.5%
 
Faircloth49.1%
 
Other2.3%


OrangeEdwards68.2%
 
Faircloth30.2%
 
Other1.6%


PamlicoEdwards56.0%
 
Faircloth41.6%
 
Other2.4%


PasquotankEdwards61.3%
 
Faircloth37.3%
 
Other1.4%


PenderEdwards56.8%
 
Faircloth41.3%
 
Other1.9%


PerquimansEdwards55.6%
 
Faircloth43.2%
 
Other1.2%


PersonEdwards50.1%
 
Faircloth48.5%
 
Other1.4%


PittEdwards53.6%
 
Faircloth45.2%
 
Other1.2%


PolkEdwards44.3%
 
Faircloth53.5%
 
Other2.2%


RandolphEdwards38.2%
 
Faircloth59.7%
 
Other2.1%


RichmondEdwards66.7%
 
Faircloth31.3%
 
Other2.0%


RobesonEdwards69.4%
 
Faircloth29.7%
 
Other0.9%


RockinghamEdwards50.6%
 
Faircloth47.1%
 
Other2.3%


RowanEdwards44.7%
 
Faircloth52.4%
 
Other2.9%


RutherfordEdwards47.8%
 
Faircloth49.7%
 
Other2.5%


SampsonEdwards46.3%
 
Faircloth53.0%
 
Other0.7%


ScotlandEdwards66.4%
 
Faircloth32.5%
 
Other1.1%


StanlyEdwards45.4%
 
Faircloth52.1%
 
Other2.5%


StokesEdwards40.6%
 
Faircloth57.7%
 
Other1.8%


SurryEdwards48.8%
 
Faircloth50.3%
 
Other0.9%


SwainEdwards52.9%
 
Faircloth45.5%
 
Other1.7%


TransylvaniaEdwards46.4%
 
Faircloth51.0%
 
Other2.6%


TyrrellEdwards65.7%
 
Faircloth33.2%
 
Other1.1%


UnionEdwards42.2%
 
Faircloth55.4%
 
Other2.3%


VanceEdwards61.4%
 
Faircloth37.9%
 
Other0.7%


WakeEdwards51.5%
 
Faircloth47.2%
 
Other1.3%


WarrenEdwards68.6%
 
Faircloth30.7%
 
Other0.6%


WashingtonEdwards65.9%
 
Faircloth32.0%
 
Other2.2%


WataugaEdwards48.2%
 
Faircloth48.5%
 
Other3.3%


WayneEdwards44.9%
 
Faircloth54.0%
 
Other1.1%


WilkesEdwards41.3%
 
Faircloth56.4%
 
Other2.4%


WilsonEdwards51.0%
 
Faircloth48.1%
 
Other0.9%


YadkinEdwards33.8%
 
Faircloth63.3%
 
Other2.9%


YanceyEdwards49.5%
 
Faircloth49.1%
 
Other1.4%


National DataGraph for 1998 - North Carolina Results for 1998

Login

Terms of Use - DCMA Policy - Privacy Policy and Cookies


© Dave Leip's Atlas of U.S. Elections, LLC 2019 All Rights Reserved