2006 Secretary of State General Election Data Graphs - Illinois
Note: The Google advertisement links below may advocate political positions that this site does not endorse.
Data for this Contest was Contributed by on 2007-04-01
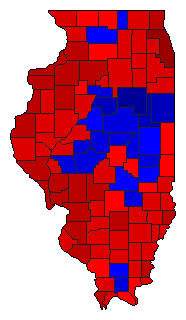
Map

AdamsWhite55.9%
 
Rutherford41.4%
 
Other2.6%


AlexanderWhite60.6%
 
Rutherford35.0%
 
Other4.4%


BondWhite59.4%
 
Rutherford37.5%
 
Other3.1%


BooneWhite45.6%
 
Rutherford46.1%
 
Other8.4%


BrownWhite59.6%
 
Rutherford37.6%
 
Other2.8%


BureauWhite60.3%
 
Rutherford35.0%
 
Other4.8%


CalhounWhite68.1%
 
Rutherford29.0%
 
Other2.9%


CarrollWhite59.9%
 
Rutherford36.0%
 
Other4.1%


CassWhite56.4%
 
Rutherford39.7%
 
Other3.9%


ChampaignWhite45.5%
 
Rutherford47.1%
 
Other7.4%


ChristianWhite52.0%
 
Rutherford44.3%
 
Other3.8%


ClarkWhite51.5%
 
Rutherford45.1%
 
Other3.4%


ClayWhite57.5%
 
Rutherford39.5%
 
Other3.0%


ClintonWhite58.0%
 
Rutherford38.4%
 
Other3.6%


ColesWhite46.8%
 
Rutherford47.7%
 
Other5.5%


CookWhite76.8%
 
Rutherford19.6%
 
Other3.6%


CrawfordWhite54.4%
 
Rutherford42.0%
 
Other3.6%


CumberlandWhite47.7%
 
Rutherford47.5%
 
Other4.8%


DeKalbWhite53.4%
 
Rutherford40.7%
 
Other5.9%


De WittWhite40.3%
 
Rutherford53.9%
 
Other5.8%


DouglasWhite41.9%
 
Rutherford53.8%
 
Other4.4%


DuPageWhite55.3%
 
Rutherford40.7%
 
Other4.0%


EdgarWhite48.9%
 
Rutherford47.1%
 
Other4.1%


EdwardsWhite52.5%
 
Rutherford44.9%
 
Other2.6%


EffinghamWhite42.8%
 
Rutherford53.6%
 
Other3.5%


FayetteWhite49.8%
 
Rutherford46.4%
 
Other3.8%


FordWhite26.6%
 
Rutherford69.6%
 
Other3.8%


FranklinWhite56.1%
 
Rutherford38.0%
 
Other6.0%


FultonWhite58.0%
 
Rutherford36.2%
 
Other5.8%


GallatinWhite64.1%
 
Rutherford30.7%
 
Other5.3%


GreeneWhite63.1%
 
Rutherford32.9%
 
Other4.0%


GrundyWhite55.9%
 
Rutherford39.5%
 
Other4.5%


HamiltonWhite59.8%
 
Rutherford37.0%
 
Other3.2%


HancockWhite60.3%
 
Rutherford35.9%
 
Other3.7%


HardinWhite56.4%
 
Rutherford40.3%
 
Other3.3%


HendersonWhite65.8%
 
Rutherford31.2%
 
Other3.0%


HenryWhite62.0%
 
Rutherford34.7%
 
Other3.3%


IroquoisWhite29.0%
 
Rutherford66.4%
 
Other4.7%


JacksonWhite49.1%
 
Rutherford40.5%
 
Other10.4%


JasperWhite58.9%
 
Rutherford38.3%
 
Other2.8%


JeffersonWhite54.1%
 
Rutherford41.7%
 
Other4.2%


JerseyWhite60.9%
 
Rutherford35.4%
 
Other3.7%


Jo DaviessWhite59.1%
 
Rutherford36.7%
 
Other4.2%


JohnsonWhite41.6%
 
Rutherford53.9%
 
Other4.5%


KaneWhite57.6%
 
Rutherford38.3%
 
Other4.1%


KankakeeWhite53.0%
 
Rutherford42.4%
 
Other4.6%


KendallWhite55.1%
 
Rutherford41.0%
 
Other4.0%


KnoxWhite61.4%
 
Rutherford35.1%
 
Other3.6%


LakeWhite60.8%
 
Rutherford35.1%
 
Other4.1%


LaSalleWhite58.4%
 
Rutherford37.3%
 
Other4.2%


LawrenceWhite62.0%
 
Rutherford34.6%
 
Other3.5%


LeeWhite48.1%
 
Rutherford46.3%
 
Other5.7%


LivingstonWhite25.4%
 
Rutherford72.4%
 
Other2.2%


LoganWhite41.9%
 
Rutherford54.0%
 
Other4.1%


McDonoughWhite59.0%
 
Rutherford36.6%
 
Other4.4%


McHenryWhite54.5%
 
Rutherford40.6%
 
Other4.9%


McLeanWhite35.6%
 
Rutherford59.4%
 
Other5.0%


MaconWhite48.9%
 
Rutherford46.7%
 
Other4.4%


MacoupinWhite65.5%
 
Rutherford31.1%
 
Other3.5%


MadisonWhite62.8%
 
Rutherford33.4%
 
Other3.8%


MarionWhite62.3%
 
Rutherford34.3%
 
Other3.5%


MarshallWhite37.9%
 
Rutherford56.7%
 
Other5.4%


MasonWhite55.5%
 
Rutherford39.3%
 
Other5.2%


MassacWhite49.6%
 
Rutherford47.2%
 
Other3.2%


MenardWhite43.8%
 
Rutherford52.1%
 
Other4.1%


MercerWhite66.7%
 
Rutherford30.7%
 
Other2.7%


MonroeWhite58.8%
 
Rutherford38.5%
 
Other2.7%


MontgomeryWhite61.2%
 
Rutherford35.5%
 
Other3.3%


MorganWhite46.1%
 
Rutherford50.2%
 
Other3.7%


MoultrieWhite48.2%
 
Rutherford47.5%
 
Other4.3%


OgleWhite42.3%
 
Rutherford49.8%
 
Other7.8%


PeoriaWhite50.5%
 
Rutherford44.6%
 
Other4.9%


PerryWhite55.1%
 
Rutherford40.0%
 
Other4.8%


PiattWhite43.7%
 
Rutherford50.6%
 
Other5.6%


PikeWhite60.0%
 
Rutherford36.3%
 
Other3.7%


PopeWhite49.3%
 
Rutherford47.0%
 
Other3.7%


PulaskiWhite54.9%
 
Rutherford41.7%
 
Other3.5%


PutnamWhite55.5%
 
Rutherford39.7%
 
Other4.7%


RandolphWhite63.7%
 
Rutherford32.8%
 
Other3.5%


RichlandWhite56.5%
 
Rutherford40.0%
 
Other3.5%


Rock IslandWhite68.8%
 
Rutherford27.9%
 
Other3.3%


St. ClairWhite64.2%
 
Rutherford32.2%
 
Other3.5%


SalineWhite53.5%
 
Rutherford41.7%
 
Other4.7%


SangamonWhite45.7%
 
Rutherford50.7%
 
Other3.6%


SchuylerWhite57.1%
 
Rutherford38.7%
 
Other4.2%


ScottWhite52.6%
 
Rutherford44.0%
 
Other3.4%


ShelbyWhite45.1%
 
Rutherford49.8%
 
Other5.1%


StarkWhite48.2%
 
Rutherford46.7%
 
Other5.1%


StephensonWhite47.6%
 
Rutherford45.1%
 
Other7.3%


TazewellWhite44.9%
 
Rutherford50.0%
 
Other5.2%


UnionWhite50.7%
 
Rutherford42.9%
 
Other6.5%


VermilionWhite48.8%
 
Rutherford46.4%
 
Other4.9%


WabashWhite54.7%
 
Rutherford42.6%
 
Other2.7%


WarrenWhite55.4%
 
Rutherford41.9%
 
Other2.7%


WashingtonWhite53.7%
 
Rutherford42.6%
 
Other3.7%


WayneWhite52.0%
 
Rutherford45.1%
 
Other3.0%


WhiteWhite56.9%
 
Rutherford39.3%
 
Other3.9%


WhitesideWhite63.1%
 
Rutherford32.8%
 
Other4.1%


WillWhite58.9%
 
Rutherford37.0%
 
Other4.0%


WilliamsonWhite47.1%
 
Rutherford47.7%
 
Other5.2%


WinnebagoWhite47.2%
 
Rutherford44.4%
 
Other8.4%


WoodfordWhite32.7%
 
Rutherford62.5%
 
Other4.9%


National DataGraph for 2006 - Illinois Results for 2006

Login

Terms of Use - DCMA Policy - Privacy Policy and Cookies


© Dave Leip's Atlas of U.S. Elections, LLC 2019 All Rights Reserved