| |
Presidential
Candidate | Vice Presidential
Candidate | Political
Party | Popular Vote | Electoral Vote |
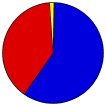
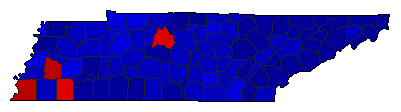
 | Willard Mitt Romney | Paul Ryan | Republican |
1,462,330 |
59.42% | 11 |
 | Barack H. Obama | Joseph R. Biden, Jr. | Democratic |
960,709 |
39.04% | 0 |
 | Gary Johnson | James P. Gray | Independent |
18,623 |
0.76% | 0 |
| Jill Stein | Cheri Honkala | Green |
6,515 |
0.26% | 0 |
| Virgil H. Goode, Jr. | James N. Clymer | Constitution |
6,022 |
0.24% | 0 |
| Ross C. 'Rocky' Anderson | | |
2,639 |
0.11% | 0 |
| Write-ins | - | - |
2,327 |
0.09% | 0 |
| Merlin Miller | Virginia D. Abernethy | Independent |
1,739 |
0.07% | 0 |
 |
Map Key
| Turnout
 |  |  |
|
|
| Election Notes:
- Official Results do not count any write-in votes. The write-ins votes listed here were collected from each county election agency (incomplete tally).
| Demographic Data
| 2012 Population: | 6,455,752 | Est. | 2012 Population Density: | 60.5 | persons/km2 | | 2010 Population: | 6,346,105 | Enum. | 2010 Population Density: | 59.4 | persons/km2 | | Total Electoral Vote: | 11 | | Electoral Vote Density: | 586,887 | persons/EV | | Land Area (2000): | 106,752 | km2 | Annual Pop Growth Rate: | 0.9 | % |
| Election Data and Statistics:
| Election Tools
- Atlas Forum Image Code for Maps: County, CD, Pop, Tnd, Swg
Data Sources:
- Source for Popular Vote data: Tennessee Secretary of State Division of Elections. November 6, 2012 General Election Official Results - President by County, Tennessee Secretary of State Division of Elections (http://www.tn.gov/sos/election/results/2012-11/USPresidentCountyTotals.pdf
) (accessed 12 Dec 2012)
- Source for Population data: U.S. Census Bureau.
| Results for and Individual County:
| | Primary Documentation:
|
| The 2012 Campaign:
|
|
| |


