| |
Presidential
Candidate | Home State | Political
Party | Caucus Result | Delegates |
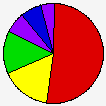
 | John Kerry | Massachusetts | Democratic |
84,818 |
51.79% | 93 | 72.7% |
 | Howard Dean | Vermont | Democratic |
27,025 |
16.50% | 24 | 18.8% |
 | Al Sharpton | New York | Democratic |
11,404 |
6.96% | 7 | 5.5% |
 | John Edwards | North Carolina | Democratic |
21,905 |
13.38% | 4 | 3.1% |
 | Wesley Clark | Arkansas | Democratic |
10,955 |
6.69% | 0 | 0.0% |
| Dennis Kucinich | Ohio | Democratic |
5,258 |
3.21% | 0 | 0.0% |
| Richard Gephardt | Missouri | Democratic |
951 |
0.58% | 0 | 0.0% |
| Joe Lieberman | Connecticut | Democratic |
659 |
0.40% | 0 | 0.0% |
| Uncommitted | - | Democratic |
497 |
0.30% | 0 | 0.0% |
| Other (+) | - | Democratic |
297 |
0.18% | 0 | 0% |
 |
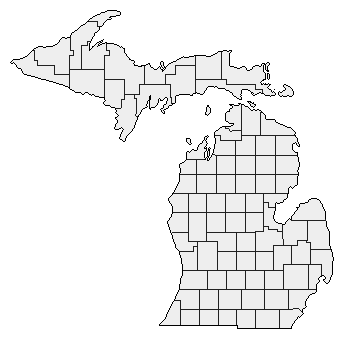
Map Key
| Turnout
 |  |  |
|
|
| | Demographic Data
| 2010 Population: | 9,883,640 | Enum. | 2010 Population Density: | 67.2 | persons/km2 | | 2004 Population: | 10,055,315 | Est. | 2004 Population Density: | 68.3 | persons/km2 | | 2000 Population: | 9,938,444 | Enum. | 2000 Population Density: | 67.6 | persons/km2 | | Total Delegates: | 128 | | Delegates Density: | 78,557 | persons/Del | | Land Area (2000): | 147,121 | km2 | Annual Pop Growth Rate: | -0.1 | % |
| Election Data and Statistics:
| Election Tools
|
|
|
|


