| |
Presidential
Candidate | Home State | Political
Party | Caucus Result | Delegates |
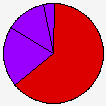
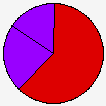
 | John Kerry | Massachusetts | Democratic |
4,730 |
63.71% | 39 | 61.9% |
 | Dennis Kucinich | Ohio | Democratic |
964 |
12.98% | 14 | 22.2% |
| Carol Moseley-Braun | Illinois | Democratic |
0 |
0.00% | 10 | 15.9% |
| Uncommitted | - | Democratic |
1,454 |
19.59% | 0 | 0.0% |
| Howard Dean | Vermont | Democratic |
182 |
2.45% | 0 | 0.0% |
| John Edwards | North Carolina | Democratic |
66 |
0.89% | 0 | 0.0% |
| Wesley Clark | Arkansas | Democratic |
25 |
0.34% | 0 | 0.0% |
| Al Sharpton | New York | Democratic |
3 |
0.04% | 0 | 0.0% |
 |
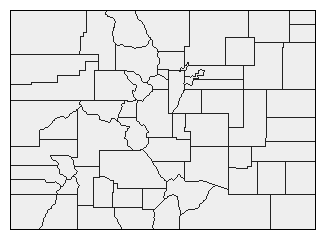
Map Key
| Turnout
 |  |  |
|
|
| | Demographic Data
| 2010 Population: | 5,029,196 | Enum. | 2010 Population Density: | 18.7 | persons/km2 | | 2004 Population: | 4,575,013 | Est. | 2004 Population Density: | 17.0 | persons/km2 | | 2000 Population: | 4,301,261 | Enum. | 2000 Population Density: | 16.0 | persons/km2 | | Total Delegates: | 63 | | Delegates Density: | 72,619 | persons/Del | | Land Area (2000): | 268,627 | km2 | Annual Pop Growth Rate: | 1.6 | % |
| Election Data and Statistics:
| Election Tools
|
|
|
|


