| |
Presidential
Candidate | Home State | Political
Party | Caucus Result | Delegates |
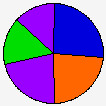
 | John McCain | Arizona | Republican |
3,191 |
25.90% | 0 | 0.0% |
 | Mike Huckabee | Arkansas | Republican |
2,898 |
23.52% | 0 | 0.0% |
 | Ron Paul | Texas | Republican |
2,666 |
21.64% | 0 | 0.0% |
 | Mitt Romney | Massachusetts | Republican |
1,903 |
15.45% | 0 | 0.0% |
| Uncommitted | - | Republican |
1,662 |
13.49% | 0 | 0.0% |
 | Unallocated | - | Republican |
- |
- | 18 | 100.0% |
 |
Map Key
| Turnout
 |  |  |
| | Election Information: | | Contest Type: | Party-run Caucus/Convention | | Caucus Date: | 2008-02-09 | | Eligible Participants: | Closed (only members of the party) | | Delegates Awarded in this Contest: | 18 | | Delegates Total: | 40 | | Delegate Allocation Method: Caucus and/or conventions - delegates are awarded through the Caucus and Convention system |
|
| Demographic Data
| 2010 Population: | 6,724,540 | Enum. | 2010 Population Density: | 39.0 | persons/km2 | | 2008 Population: | 6,562,231 | Est. | 2008 Population Density: | 38.1 | persons/km2 | | 2000 Population: | 5,894,121 | Enum. | 2000 Population Density: | 34.2 | persons/km2 | | Total Delegates: | 18 | | Delegates Density: | 364,568 | persons/Del | | Land Area (2000): | 172,348 | km2 | Annual Pop Growth Rate: | 1.3 | % |
| Election Data and Statistics:
| Data Sources:
- Source for Popular Vote data:
- Source for Population data: U.S. Census Bureau.
|
| |
| |
Presidential
Candidate | Home State | Political
Party | Primary Vote | Delegates |
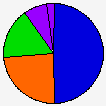
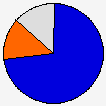
| John McCain | Arizona | Republican |
262,304 |
49.44% | 16 | 72.7% |
| Mike Huckabee | Arkansas | Republican |
127,657 |
24.06% | 3 | 13.6% |
| Mitt Romney | Massachusetts | Republican |
86,140 |
16.24% | 0 | 0.0% |
| Ron Paul | Texas | Republican |
40,539 |
7.64% | 0 | 0.0% |
| Rudolph W. Giuliani | New York | Republican |
5,145 |
0.97% | 0 | 0.0% |
| Fred Thompson | Tennessee | Republican |
4,865 |
0.92% | 0 | 0.0% |
| Alan Keyes | Maryland | Republican |
2,226 |
0.42% | 0 | 0.0% |
| Other (+) | - | Republican |
1,633 |
0.31% | 0 | 0% |
| Unallocated | - | Republican |
- |
- | 3 | 13.6% |
|
Map Key
| Turnout
|  |  |
|
|
| | Election Information: | | Contest Type: | State-run Primary | | Election Date: | 2008-02-19 | | Eligible Participants: | Closed (only members of the party) | | Delegates Awarded in this Contest: | 19 | | Delegates Total: | 40 | | Delegate Allocation Method: Winner-take-all if Majority, otherwise proportional allocation. If the candidate having received the highest number of votes has one more vote than half of all votes cast for candidates, then the candidate receives all of the delegates. Otherwise, the delegates are awarded proportionally. |
- 10 at-large delegates are allocated proportionally to candidates based on the percentage of votes received statewide. A 20 percent minimum threshold is required to receive delegates.
- 9 district delegates (1 for each of the 9 congressional districts) : the candidate receiving the highest number of votes in each congressional district is awarded three delegates.
|
|
| Demographic Data
| 2010 Population: | 6,724,540 | Enum. | 2010 Population Density: | 39.0 | persons/km2 | | 2008 Population: | 6,562,231 | Est. | 2008 Population Density: | 38.1 | persons/km2 | | 2000 Population: | 5,894,121 | Enum. | 2000 Population Density: | 34.2 | persons/km2 | | Total Delegates: | 22 | | Delegates Density: | 298,283 | persons/Del | | Land Area (2000): | 172,348 | km2 | Annual Pop Growth Rate: | 1.3 | % |
| Election Data and Statistics:
| Election Tools
|
| |
|


