Home
2024
Election Results
Election Info
Weblog
Forum
Wiki
Search
Email
Login
Site Info
Store
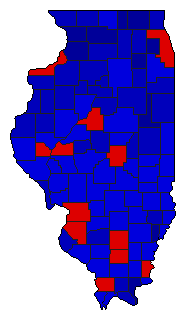
1944 Gubernatorial General Election Results - Illinois
Note: The Google advertisement links below may advocate political positions that this site does not endorse.
Data for this Contest was Contributed by on 2011-08-22
Gubernatorial
Candidate
Political
Party
Popular Vote
Dwight H. Green
Republican
2,013,270
50.75%
Thomas J. Courtney
Democratic
1,940,999
48.93%
Other (
+
)
-
12,496
0.32%
Map Key
> 40%
> 50%
> 60%
> 70%
Turnout
Maps
Demographic Data
1950 Population:
8,712,176
Enum.
1950 Population Density:
60.5
persons/km
2
1940 Population:
7,897,241
Enum.
1940 Population Density:
54.9
persons/km
2
Land Area (2000):
143,961
km
2
Annual Pop Growth Rate:
1.0
%
Election Data and Statistics:
County Data (Table)
(m)
County Data (Graphs)
(m)
Compare State Data by Year (Table)
Compare State Data by Year (Graphs)
View All 1944 Illinois Data
Compare State Maps by Year
View All 1944 Illinois Maps
Election Tools
Atlas Forum
Image Code for Maps:
County
Data Sources:
Source for Popular Vote data: Illinois Secretary of State, comp, "Official Vote Cast for Governor,"
Official Vote of the State of Illinois Cast at the General Election of November 7, 1944
(Springfield: Illinois State Printing Company, 1945)
Source for Population data: U.S. Census Bureau.
Results for and Individual County:
(m)
Choose Year
2022
2018
2014
2010
2006
2002
1998
1994
1990
1986
1982
1978
1976
1972
1968
1964
1960
1956
1952
1948
1940
1936
1932
1928
1924
1920
1916
1912
1908
1904
1900
1864
1822
1818
Choose Office
President
Senator
Secretary of State
Choose State
Arizona
Colorado
Delaware
Indiana
Iowa
Massachusetts
Michigan
Minnesota
Montana
New Hampshire
Ohio
Utah
Vermont
Washington
Wisconsin
1990 >
Illinois Election Results Home
-
National Results for 1944
-
Use Frame Navigation
Login
Terms of Use
-
DCMA Policy
-
Privacy Policy and Cookies
©
Dave Leip's Atlas of U.S. Elections, LLC 2019 All Rights Reserved


