Note: The Google advertisement links below may advocate political positions that this site does not endorse.
Advertisements


Discuss Politics
ad image
Have an opinion? Enjoy discussing elections or politics? Join the conversation on the Atlas Forum discussion board. More info


Advertise on the Atlas

History Posters!
Dow Jones


Election and History Posters from History Shots!

Note: click will open in new window if pop-ups allowed


Buy Stuff


Advertisements


Affiliates

  Presidential
Candidate
Vice Presidential
Candidate
Political
Party
Popular VoteElectoral Vote
Barack H. ObamaJoseph R. Biden, Jr.Democratic 3,419,348 61.85%21
John S. McCain, IIISarah PalinRepublican 2,031,179 36.74%0
Ralph NaderMatt GonzalezIndependent 31,152 0.56%0
Bob BarrWayne A. RootLibertarian 19,642 0.36%0
YOther (+) - - 27,034 0.49%0
Seal Map Key
 > 40%
 > 50%
 > 60%
 > 70%
Turnout
Voter Turnout Graph
Vote Pie ChartState Seal
Maps2008 Illinois County Map of General Election Results for President
County Button
2000 Button
Pop Button
Per Vote Democratic Button
Per Vote Republican Button
Swing Map Button
Trend Map Button
 
Demographic Data

2008 Population:12,901,563Est.2008 Population Density:89.6persons/km2
2000 Population:12,419,293Enum.2000 Population Density:86.3persons/km2
Total Electoral Vote:21Electoral Vote Density:614,360persons/EV
Land Area (2000):143,961km2Annual Pop Growth Rate:0.5%

Election Data and Statistics:
Election Tools
Data Sources:
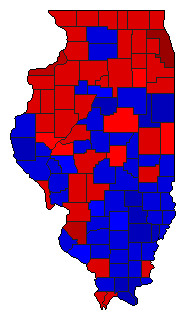
  • Source for Popular Vote data: Illinois State Board of Elections. Ballots Cast General Election - 11/4/2008 President and Vice President, Illinois State Board of Elections (http://www.elections.state.il.us/) (accessed 01 Dec 2008)
  • Source for Population data: U.S. Census Bureau.
Results for and Individual County:
Primary Documentation:
  • 2008 Certificate of Ascertainment (m)
  • 2008 Certificate of Vote (m)
The 2008 Campaign:


Illinois Election Results Home - National Results for 2008 - Use Frame Navigation - Login

© David Leip 2005 All Rights Reserved