| |
Presidential
Candidate | Vice Presidential
Candidate | Political
Party | Popular Vote | Electoral Vote |
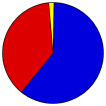
 | Willard Mitt Romney | Paul Ryan | Republican |
1,087,190 |
60.47% | 8 |
 | Barack H. Obama | Joseph R. Biden, Jr. | Democratic |
679,370 |
37.78% | 0 |
 | Gary Johnson | James P. Gray | Libertarian |
17,063 |
0.95% | 0 |
| Randall Terry | Missy R. Smith | Independent |
6,872 |
0.38% | 0 |
| Jill Stein | Cheri Honkala | Green |
6,337 |
0.35% | 0 |
| Other (+) | - | - |
1,216 |
0.07% | 0 |
 |
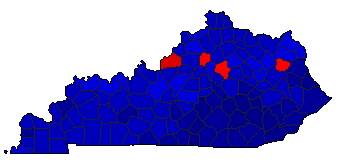
Map Key
| > 40% |
 |
 |
| > 50% |
 |
 |
| > 60% |
|
 |
| > 70% |
|
 |
| > 80% |
|
 |
| Turnout
 |  |  |
|
|
| Demographic Data
| 2012 Population: | 4,387,865 | Est. | 2012 Population Density: | 42.6 | persons/km2 | | 2010 Population: | 4,339,367 | Enum. | 2010 Population Density: | 42.2 | persons/km2 | | Total Electoral Vote: | 8 | | Electoral Vote Density: | 548,483 | persons/EV | | Land Area (2000): | 102,896 | km2 | Annual Pop Growth Rate: | 0.6 | % |
| Election Data and Statistics:
| Election Tools
- Atlas Forum Image Code for Maps: County, CD, Pop, Tnd, Swg
Data Sources:
- Source for Popular Vote data: Kentucky State Board of Elections. November 6, 2012 Official 2012 General Election Results For the office of President and Vice President of the United States, Kentucky State Board of Elections (http://elect.ky.gov/SiteCollectionDocuments/Election%20Results/2010-2019/2012/2012genresults.pdf
) (accessed 28 Nov 2012)
- Source for Population data: U.S. Census Bureau.
| Results for and Individual County:
| | Primary Documentation:
|
| The 2012 Campaign:
|
|
| |


