| |
Presidential
Candidate | Vice Presidential
Candidate | Political
Party | Popular Vote | Electoral Vote |
 | John Kennedy | Lyndon Johnson | Democrat |
1,167,567 |
50.52% | 24 |
 | Richard Nixon | Henry Lodge | Republican |
1,121,310 |
48.52% | 0 |
 | Charles Sullivan | Merritt Curtis | Constitution |
18,162 |
0.79% | 0 |
| Other (+) | - | - |
4,045 |
0.18% | 0 |
 |
Map Key
| > 40% |
 |
 |
| > 50% |
 |
 |
| > 60% |
 |
 |
| > 70% |
 |
 |
| > 80% |
 |
 |
| > 90% |
 |
|
| Turnout
 |  |  |
|
| Maps | 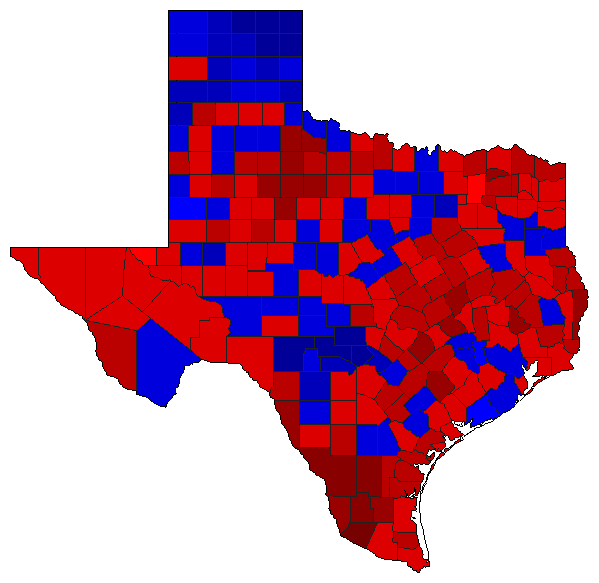 |  | | Pop. (m) | | Dem. (m) | | Rep. (m) | | Swg (m) | | Tnd (m) |
| |
| Demographic Data
| 1960 Population: | 9,579,677 | Enum. | 1960 Population Density: | 14.1 | persons/km2 | | 1950 Population: | 7,711,194 | Enum. | 1950 Population Density: | 11.4 | persons/km2 | | Total Electoral Vote: | 24 | | Electoral Vote Density: | 399,153 | persons/EV | | Land Area (2000): | 678,051 | km2 | Annual Pop Growth Rate: | 2.2 | % |
| Election Data and Statistics:
| Election Tools
- Atlas Forum Image Code for Maps: County, Pop, Tnd, Swg
Data Sources:
- Source for Popular Vote data: Texas Secretary of State, County by County Tabulation of the votes cast at the General Election, November 8, 1960, for the offices of the President and Vice-President (Austin, 1960)
- Source for Population data: U.S. Census Bureau.
| Results for and Individual County:
|
|
| |


