Home
2024
Election Results
Election Info
Weblog
Forum
Wiki
Search
Email
Login
Site Info
Store
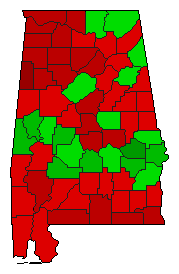
1999 Referendum Special Election Results - Alabama
Note: The Google advertisement links below may advocate political positions that this site does not endorse.
Data for this Contest was Contributed by on 2007-04-08
Referendum: Amendment #1 (Lottery)
Popular Vote
No
672,802
54.21%
Yes
568,289
45.79%
Map Key
> 40%
> 50%
> 60%
> 70%
Turnout
Maps
Pop. (m)
Election Notes:
This Amendment sought to create a statewide lottery.
Demographic Data
2000 Population:
4,447,100
Enum.
2000 Population Density:
33.8
persons/km
2
1999 Population:
4,430,141
Est.
1999 Population Density:
33.7
persons/km
2
1990 Population:
4,040,389
Enum.
1990 Population Density:
30.7
persons/km
2
Land Area (2000):
131,426
km
2
Annual Pop Growth Rate:
1.0
%
Election Data and Statistics:
County Data (Table)
(m)
County Data (Graphs)
Purchase Detailed Data
Compare State Maps by Year
View All 1999 Alabama Maps
Election Tools
Atlas Forum
Image Code for Maps:
County
,
Pop
Data Sources:
Source for Popular Vote data: Alabama Secretary of State.
County-Level Results for Statewide Amendments
, Alabama Secretary of State (http://www.sos.state.al.us/election/1999/99sce-cl.cfm) (accessed 08 Apr 2007)
Source for Population data: U.S. Census Bureau.
Results for and Individual County:
(m)
Choose Year
2006
Choose Office
Choose State
Kansas
Alabama Election Results Home
-
National Results for 1999
-
Use Frame Navigation
Login
Terms of Use
-
DCMA Policy
-
Privacy Policy and Cookies
©
Dave Leip's Atlas of U.S. Elections, LLC 2019 All Rights Reserved


