| |
Presidential
Candidate | Home State | Political
Party | Primary Vote | Delegates |
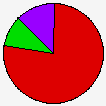
 | John Kerry | Massachusetts | Democratic |
581,672 |
77.17% | 174 | 98.3% |
 | John Edwards | North Carolina | Democratic |
75,703 |
10.04% | 3 | 1.7% |
 | Al Sharpton | New York | Democratic |
21,031 |
2.79% | 0 | 0.0% |
| Howard Dean | Vermont | Democratic |
20,834 |
2.76% | 0 | 0.0% |
| Dennis Kucinich | Ohio | Democratic |
17,198 |
2.28% | 0 | 0.0% |
| Joe Lieberman | Connecticut | Democratic |
14,287 |
1.90% | 0 | 0.0% |
| Wesley Clark | Arkansas | Democratic |
10,226 |
1.36% | 0 | 0.0% |
| Carol Moseley-Braun | Illinois | Democratic |
6,789 |
0.90% | 0 | 0.0% |
| Richard Gephardt | Missouri | Democratic |
6,022 |
0.80% | 0 | 0.0% |
 |
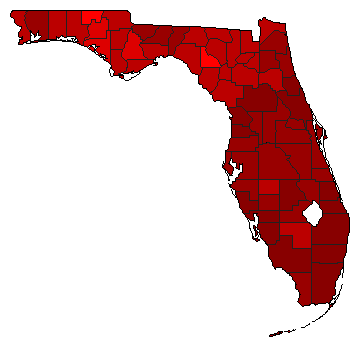
Map Key
| > 40% |
 |
 |
| > 50% |
 |
|
| > 60% |
 |
|
| > 70% |
 |
|
| > 80% |
 |
|
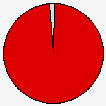
| Turnout
 |  |  |
|
|
| | Demographic Data
| 2010 Population: | 18,801,310 | Enum. | 2010 Population Density: | 134.6 | persons/km2 | | 2004 Population: | 17,415,318 | Est. | 2004 Population Density: | 124.7 | persons/km2 | | 2000 Population: | 15,982,378 | Enum. | 2000 Population Density: | 114.4 | persons/km2 | | Total Delegates: | 177 | | Delegates Density: | 98,392 | persons/Del | | Land Area (2000): | 139,670 | km2 | Annual Pop Growth Rate: | 1.6 | % |
| Election Data and Statistics:
| Election Tools
|
|
|
|


