Home
2024
Election Results
Election Info
Weblog
Forum
Wiki
Search
Email
Login
Site Info
Store
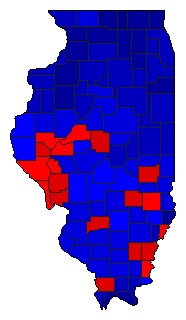
1904 Gubernatorial General Election Results - Illinois
Note: The Google advertisement links below may advocate political positions that this site does not endorse.
Data for this Contest was Contributed by on 2010-10-24
Gubernatorial
Candidate
Political
Party
Popular Vote
Charles S. Deneen
Republican
634,029
59.09%
Lawrence B. Stringer
Democratic
334,880
31.21%
John Collins
Socialist
59,062
5.50%
Robert H. Patton
Prohibition
35,440
3.30%
Philip Veal
Socialist Labor
4,379
0.41%
James Hogan
People's
4,364
0.41%
Andrew G. Specht
Continental
780
0.07%
Map Key
> 40%
> 50%
> 60%
> 70%
> 80%
Turnout
Maps
Demographic Data
1910 Population:
5,638,591
Enum.
1910 Population Density:
39.2
persons/km
2
1900 Population:
4,821,550
Enum.
1900 Population Density:
33.5
persons/km
2
Land Area (2000):
143,961
km
2
Annual Pop Growth Rate:
1.6
%
Election Data and Statistics:
County Data (Table)
(m)
County Data (Graphs)
(m)
Compare State Data by Year (Table)
Compare State Data by Year (Graphs)
View All 1904 Illinois Data
Compare State Maps by Year
View All 1904 Illinois Maps
Election Tools
Atlas Forum
Image Code for Maps:
County
Data Sources:
Source for Popular Vote data: Illinois Secretary of State, Comp, "General Election IL Governor,"
Blue Book of the State of Illinois, 1905-1906
(Springfield: Illinois State Journal Company, State Printers, 1905)
Source for Population data: U.S. Census Bureau.
Results for and Individual County:
(m)
Choose Year
2022
2018
2014
2010
2006
2002
1998
1994
1990
1986
1982
1978
1976
1972
1968
1964
1960
1956
1952
1948
1944
1940
1936
1932
1928
1924
1920
1916
1912
1908
1900
1864
1822
1818
Choose Office
President
Choose State
Colorado
Indiana
Massachusetts
Michigan
Minnesota
Missouri
New Jersey
North Dakota
Washington
1990 >
Illinois Election Results Home
-
National Results for 1904
-
Use Frame Navigation
Login
Terms of Use
-
DCMA Policy
-
Privacy Policy and Cookies
©
Dave Leip's Atlas of U.S. Elections, LLC 2019 All Rights Reserved


