Home
2024
Election Results
Election Info
Weblog
Forum
Wiki
Search
Email
Login
Site Info
Store
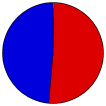
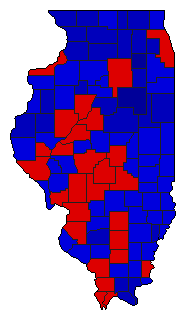
1968 State Auditor General Election Results - Illinois
Note: The Google advertisement links below may advocate political positions that this site does not endorse.
Data for this Contest was Contributed by on 2018-10-28
State Auditor
Candidate
Political
Party
Popular Vote
Michael J. Howlett
Democratic
2,215,401
50.99%
William C. Harris
Republican
2,106,676
48.49%
Elizabeth Schnur
Socialist Labor
22,591
0.52%
Write-ins
-
1
0.00%
Map Key
> 40%
> 50%
> 60%
> 70%
Turnout
Maps
Demographic Data
1970 Population:
11,110,285
Enum.
1970 Population Density:
77.2
persons/km
2
1960 Population:
10,081,158
Enum.
1960 Population Density:
70.0
persons/km
2
Land Area (2000):
143,961
km
2
Annual Pop Growth Rate:
1.0
%
Election Data and Statistics:
County Data (Table)
(m)
County Data (Graphs)
Compare State Data by Year (Table)
Compare State Data by Year (Graphs)
View All 1968 Illinois Data
Compare State Maps by Year
View All 1968 Illinois Maps
Election Tools
Atlas Forum
Image Code for Maps:
County
Data Sources:
Source for Popular Vote data: Illinois State Board of Elections.
Canvass of Returns of General Election Held on November 5, 1968
, Illinois State Board of Elections (https://archive.org/details/officialvote1968illi) (accessed 28 Oct 2018)
Source for Population data: U.S. Census Bureau.
Results for and Individual County:
(m)
Choose Year
1932
1928
1924
1920
Choose Office
President
Senator
Governor
Lt. Governor
Secretary of State
Attorney General
Choose State
Arizona
Delaware
Indiana
Kansas
New Mexico
North Carolina
North Dakota
Pennsylvania
South Dakota
Washington
Illinois Election Results Home
-
National Results for 1968
-
Use Frame Navigation
Login
Terms of Use
-
DCMA Policy
-
Privacy Policy and Cookies
©
Dave Leip's Atlas of U.S. Elections, LLC 2019 All Rights Reserved


