Home
2024
Election Results
Election Info
Weblog
Forum
Wiki
Search
Email
Login
Site Info
Store
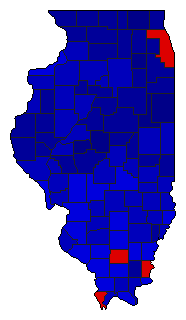
1998 Attorney General General Election Results - Illinois
Note: The Google advertisement links below may advocate political positions that this site does not endorse.
Data for this Contest was Contributed by on 2007-05-18
Attorney General
Candidate
Political
Party
Popular Vote
Jim Ryan
Republican
2,026,781
60.92%
Miriam Santos
Democratic
1,242,979
37.36%
Jesse M. Dowell, Jr.
Reform
56,944
1.71%
Map Key
> 50%
> 60%
> 70%
> 80%
Turnout
Maps
Pop. (m)
Demographic Data
2000 Population:
12,419,293
Enum.
2000 Population Density:
86.3
persons/km
2
1998 Population:
12,271,847
Est.
1998 Population Density:
85.2
persons/km
2
1990 Population:
11,430,602
Enum.
1990 Population Density:
79.4
persons/km
2
Land Area (2000):
143,961
km
2
Annual Pop Growth Rate:
0.8
%
Election Data and Statistics:
County Data (Table)
(m)
County Data (Graphs)
Purchase Detailed Data
Compare State Data by Year (Table)
Compare State Data by Year (Graphs)
View All 1998 Illinois Data
Compare State Maps by Year
View All 1998 Illinois Maps
Election Tools
Atlas Forum
Image Code for Maps:
County
,
Pop
Data Sources:
Source for Popular Vote data: Illinois State Board of Elections.
1998 General Election
, Illinois State Board of Elections (http://www.elections.il.gov/ElectionInformation/DownloadVoteTotals.aspx) (accessed 18 May 2007)
Source for Population data: U.S. Census Bureau.
Results for and Individual County:
(m)
Choose Year
2022
2018
2014
2010
2006
2002
1994
1990
1986
1982
1978
1976
1972
1968
1932
1928
1924
1920
Choose Office
Senator
Governor
Secretary of State
State Treasurer
Comptroller General
Choose State
Alabama
Arizona
Arkansas
California
Colorado
Connecticut
Florida
Georgia
Idaho
Iowa
Kansas
Maryland
Massachusetts
Michigan
Minnesota
Nebraska
Nevada
New Mexico
New York
Ohio
Rhode Island
South Carolina
Texas
Vermont
Wisconsin
2022 >
Illinois Election Results Home
-
National Results for 1998
-
Use Frame Navigation
Login
Terms of Use
-
DCMA Policy
-
Privacy Policy and Cookies
©
Dave Leip's Atlas of U.S. Elections, LLC 2019 All Rights Reserved


