| |
Presidential
Candidate | Home State | Political
Party | Primary Vote | Delegates |
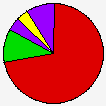
 | John Kerry | Massachusetts | Democratic |
873,230 |
71.72% | 155 | 99.4% |
 | John Edwards | North Carolina | Democratic |
131,966 |
10.84% | 1 | 0.6% |
 | Carol Moseley-Braun | Illinois | Democratic |
53,249 |
4.37% | 0 | 0.0% |
 | Howard Dean | Vermont | Democratic |
47,343 |
3.89% | 0 | 0.0% |
| Al Sharpton | New York | Democratic |
36,123 |
2.97% | 0 | 0.0% |
| Dennis Kucinich | Ohio | Democratic |
28,083 |
2.31% | 0 | 0.0% |
| Joe Lieberman | Connecticut | Democratic |
24,354 |
2.00% | 0 | 0.0% |
| Wesley Clark | Arkansas | Democratic |
19,304 |
1.59% | 0 | 0.0% |
| Lyndon Larouche, Jr | Virginia | Democratic |
3,863 |
0.32% | 0 | 0.0% |
 |
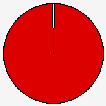
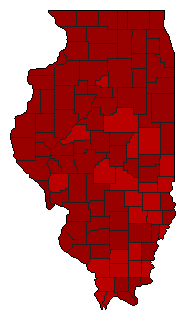
Map Key
| Turnout
 |  |  |
|
|
| | Demographic Data
| 2010 Population: | 12,830,632 | Enum. | 2010 Population Density: | 89.1 | persons/km2 | | 2004 Population: | 12,589,773 | Est. | 2004 Population Density: | 87.5 | persons/km2 | | 2000 Population: | 12,419,293 | Enum. | 2000 Population Density: | 86.3 | persons/km2 | | Total Delegates: | 156 | | Delegates Density: | 80,704 | persons/Del | | Land Area (2000): | 143,961 | km2 | Annual Pop Growth Rate: | 0.3 | % |
| Election Data and Statistics:
| Election Tools
|
|
|
|


