Home
2024
Election Results
Election Info
Weblog
Forum
Wiki
Search
Email
Login
Site Info
Store
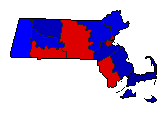
1946 Lt. Gubernatorial General Election Results - Massachusetts
Note: The Google advertisement links below may advocate political positions that this site does not endorse.
Data for this Contest was Contributed by on 2012-06-15
Lt. Gubernatorial
Candidate
Political
Party
Popular Vote
Arthur W. Coolidge
Republican
827,192
49.72%
Paul A. Dever
Democratic
820,405
49.31%
Francis A. Votano
Socialist Labor
10,768
0.65%
Alfred Erickson
Prohibition
5,398
0.32%
Map Key
> 40%
> 50%
> 60%
> 70%
Turnout
Maps
Demographic Data
1950 Population:
4,690,514
Enum.
1950 Population Density:
231.0
persons/km
2
1940 Population:
4,316,721
Enum.
1940 Population Density:
212.6
persons/km
2
Land Area (2000):
20,306
km
2
Annual Pop Growth Rate:
0.8
%
Election Data and Statistics:
County Data (Table)
(m)
County Data (Graphs)
(m)
Compare State Data by Year (Table)
Compare State Data by Year (Graphs)
View All 1946 Massachusetts Data
Compare State Maps by Year
View All 1946 Massachusetts Maps
Election Tools
Atlas Forum
Image Code for Maps:
County
Data Sources:
Source for Popular Vote data: Massachusetts Secretary of State.
Election Statistics (1946)
, Massachusetts Secretary of State (archive.org/details/electionstatisti19461948mass) (accessed 15 Jun 2012)
Source for Population data: U.S. Census Bureau.
Results for and Individual County:
(m)
Choose Year
1966
1964
1962
1960
1958
1956
1954
1952
1950
1948
1944
1942
1940
1938
1936
1934
1932
1930
1928
1926
1924
1922
1920
1919
1918
1917
1916
1915
1914
1913
1912
1911
1910
1909
1908
1902
1901
1900
1899
1898
1897
Choose Office
Senator
Governor
Secretary of State
Choose State
California
Colorado
Iowa
Minnesota
Nevada
New York
Massachusetts Election Results Home
-
National Results for 1946
-
Use Frame Navigation
Login
Terms of Use
-
DCMA Policy
-
Privacy Policy and Cookies
©
Dave Leip's Atlas of U.S. Elections, LLC 2019 All Rights Reserved


