Home
2024
Election Results
Election Info
Weblog
Forum
Wiki
Search
Email
Login
Site Info
Store
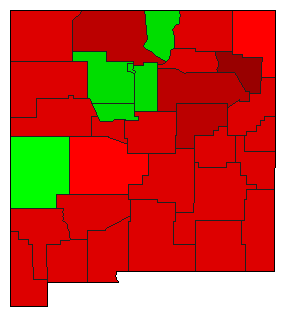
2008 Presidential Democratic Primary Election Results
Note: The Google advertisement links below may advocate political positions that this site does not endorse.
Presidential
Candidate
Home State
Political
Party
Primary Vote
Delegates
Hillary Clinton
New York
Democratic
73,105
48.94%
14
36.8%
Barack Obama
Illinois
Democratic
71,396
47.80%
12
31.6%
John Edwards
North Carolina
Democratic
2,157
1.44%
0
0.0%
Bill Richardson
New Mexico
Democratic
1,305
0.87%
0
0.0%
Dennis J. Kucinich
Ohio
Democratic
574
0.38%
0
0.0%
Uncommitted
-
Democratic
441
0.30%
0
0.0%
Other (
+
)
-
Democratic
401
0.27%
0
0%
Unallocated
-
Democratic
-
-
12
31.6%
Map Key
> 40%
> 50%
> 60%
> 70%
Turnout
Maps
Election Information:
Contest Type:
Party-run Primary
Election Date:
2008-02-05
Eligible Participants:
Closed (only members of the party)
Delegates Awarded in this Contest:
26
Delegates Total:
38
Delegate Allocation Method:
Proportional - the candidates are awarded delegates in proportion to the percentage of votes received. A 15% threshold is required to receive delegates.
9 at-large delegates
17 district delegates
12 unpledged delegates
Congressional District 1: 6 delegates
Congressional District 2: 5 delegates
Congressional District 3: 6 delegates
Demographic Data
2010 Population:
2,059,179
Enum.
2010 Population Density:
6.6
persons/km
2
2008 Population:
2,010,662
Est.
2008 Population Density:
6.4
persons/km
2
2000 Population:
1,819,046
Enum.
2000 Population Density:
5.8
persons/km
2
Total Delegates:
38.0
Delegates Density:
52,912
persons/Del
Land Area (2000):
314,309
km
2
Annual Pop Growth Rate:
1.2
%
Election Data and Statistics:
County Data (Table)
(m)
County Data (Graphs)
Congressional District Data
(m)
Purchase Detailed Data
Compare State Maps by Year
View All 2008 New Mexico Maps
Election Tools
2008 Democratic Primary Timeline
Atlas Forum
Image Code for Maps:
County
,
CD
,
Pop
Data Sources:
Source for Popular Vote data:
Source for Population data: U.S. Census Bureau.
Results for and Individual County:
Bernalillo County
Catron County
Chaves County
Cibola County
Colfax County
Curry County
De Baca County
Dona Ana County
Eddy County
Grant County
Guadalupe County
Harding County
Hidalgo County
Lea County
Lincoln County
Los Alamos County
Luna County
McKinley County
Mora County
Otero County
Quay County
Rio Arriba County
Roosevelt County
Sandoval County
San Juan County
San Miguel County
Santa Fe County
Sierra County
Socorro County
Taos County
Torrance County
Union County
Valencia County
< 2004
Choose Year
2020
2016
2004
2000
1992
Choose Office
Choose Party
Republican
Choose State
Alabama
Alaska
American Samoa
Arizona
Arkansas
California
Colorado
Colorado
Connecticut
Delaware
District of Columbia
Florida
Georgia
Guam
Hawaii
Idaho
Idaho
Illinois
Indiana
Iowa
Iowa
Kansas
Kentucky
Louisiana
Maine
Maryland
Massachusetts
Michigan
Minnesota
Mississippi
Missouri
Montana
Nebraska
Nebraska
Nevada
Nevada
New Hampshire
New Jersey
New York
North Carolina
North Dakota
Ohio
Oklahoma
Oregon
Pennsylvania
Puerto Rico
Rhode Island
South Carolina
South Dakota
Tennessee
Texas
Texas
Texas
Utah
Vermont
Virgin Islands
Virginia
Washington
Washington
West Virginia
Wisconsin
Wyoming
2016 >
New Mexico Election Results Home
-
National Results for 2008
-
Use Frame Navigation
Login
Terms of Use
-
DCMA Policy
-
Privacy Policy and Cookies
©
Dave Leip's Atlas of U.S. Elections, LLC 2019 All Rights Reserved


