| |
Presidential
Candidate | Home State | Political
Party | Primary Vote | Delegates |
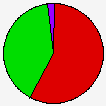
 | Hillary Clinton | New York | Democratic |
1,068,496 |
57.37% | 139 | 49.3% |
 | Barack Obama | Illinois | Democratic |
751,019 |
40.32% | 93 | 33.0% |
 | John Edwards | North Carolina | Democratic |
21,924 |
1.18% | 0 | 0.0% |
| Dennis J. Kucinich | Ohio | Democratic |
8,458 |
0.45% | 0 | 0.0% |
| Bill Richardson | New Mexico | Democratic |
8,227 |
0.44% | 0 | 0.0% |
| Other (+) | - | Democratic |
4,325 |
0.23% | 0 | 0% |
 | Unallocated | - | Democratic |
- |
- | 50 | 17.7% |
 |
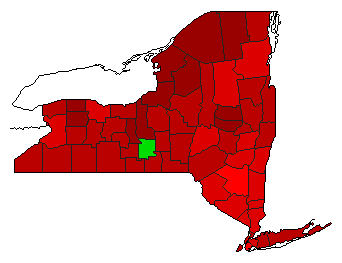
Map Key
| Turnout
 |  |  |
|
|
| | Election Information: | | Contest Type: | State-run Primary | | Election Date: | 2008-02-05 | | Eligible Participants: | Closed (only members of the party) | | Delegates Awarded in this Contest: | 232 | | Delegates Total: | 282 | | Delegate Allocation Method: Proportional - the candidates are awarded delegates in proportion to the percentage of votes received. A 15% threshold is required to receive delegates. |
- 81 at-large delegates
- 151 district delegates
- 49 unpledged delegates
- 5 delegates from CDs 1, 2, 3, 4, 5, 6, 7, 9, 10, 12, 13, 16, 17, 19, 20, 22, 23, 24, 25, 26, 27, 28, 29
- 6 delegates from CDs 8, 11, 14, 15, 18, 21
|
|
| Demographic Data
| 2010 Population: | 19,378,102 | Enum. | 2010 Population Density: | 158.5 | persons/km2 | | 2008 Population: | 19,212,436 | Est. | 2008 Population Density: | 157.1 | persons/km2 | | 2000 Population: | 18,976,457 | Enum. | 2000 Population Density: | 155.2 | persons/km2 | | Total Delegates: | 282.0 | | Delegates Density: | 68,129 | persons/Del | | Land Area (2000): | 122,283 | km2 | Annual Pop Growth Rate: | 0.2 | % |
| Election Data and Statistics:
| Election Tools
|
| |


