Home
2024
Election Results
Election Info
Weblog
Forum
Wiki
Search
Email
Login
Site Info
Store
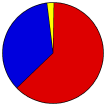
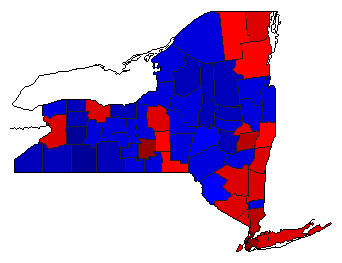
2018 Attorney General General Election Results
Note: The Google advertisement links below may advocate political positions that this site does not endorse.
Data for this Contest was Contributed by on 2019-03-16
Attorney General
Candidate
Political
Party
Popular Vote
Letitia James
Democratic
3,739,239
62.39%
Keith Wofford
Republican
2,108,600
35.18%
Michael Sussman
Green
72,512
1.21%
Christopher B. Garvey
Libertarian
43,767
0.73%
Nancy Sliwa
Reform
26,441
0.44%
Write-ins
-
2,958
0.05%
Map Key
> 40%
> 50%
> 60%
> 70%
> 80%
> 90%
Turnout
Maps
Election Notes:
Letitia James was elected on a
fusion
ticket of the Democratic Party, the Working Families Party, and the Independence Party.
Keith Wofford was elected on a
fusion
ticket of the Republican Party and the Conservative Party
Election Data and Statistics:
County Data (Table)
(m)
County Data (Graphs)
Purchase Detailed Data
Compare State Data by Year (Table)
Compare State Data by Year (Graphs)
View All 2018 New York Data
Compare State Maps by Year
View All 2018 New York Maps
Election Tools
Atlas Forum
Image Code for Maps:
County
,
Pop
Data Sources:
Source for Popular Vote data: New York State Board of Elections.
2018 Election Results
, New York State Board of Elections (https://www.elections.ny.gov/2018ElectionResults.html) (accessed 15 March 201)
Source for Population data: U.S. Census Bureau.
Results for and Individual County:
Albany County
Allegany County
Bronx County
Broome County
Cattaraugus County
Cayuga County
Chautauqua County
Chemung County
Chenango County
Clinton County
Columbia County
Cortland County
Delaware County
Dutchess County
Erie County
Essex County
Franklin County
Fulton County
Genesee County
Greene County
Hamilton County
Herkimer County
Jefferson County
Kings County
Lewis County
Livingston County
Madison County
Monroe County
Montgomery County
Nassau County
New York County
Niagara County
Oneida County
Onondaga County
Ontario County
Orange County
Orleans County
Oswego County
Otsego County
Putnam County
Queens County
Rensselaer County
Richmond County
Rockland County
St. Lawrence County
Saratoga County
Schenectady County
Schoharie County
Schuyler County
Seneca County
Steuben County
Suffolk County
Sullivan County
Tioga County
Tompkins County
Ulster County
Warren County
Washington County
Wayne County
Westchester County
Wyoming County
Yates County
Choose Year
2022
2014
2010
2006
2002
1998
1994
1966
1962
1958
1946
Choose Office
Senator
Governor
Comptroller General
Choose State
Alabama
Arizona
Arkansas
California
Colorado
Connecticut
Delaware
Florida
Georgia
Idaho
Illinois
Iowa
Kansas
Maryland
Massachusetts
Michigan
Minnesota
Nebraska
Nevada
New Mexico
North Dakota
Ohio
Oklahoma
Rhode Island
South Carolina
South Dakota
Texas
Wisconsin
2022 >
New York Election Results Home
-
National Results for 2018
-
Use Frame Navigation
View Large Map Page for This Contest
Login
Terms of Use
-
DCMA Policy
-
Privacy Policy and Cookies
©
Dave Leip's Atlas of U.S. Elections, LLC 2019 All Rights Reserved