Home
2024
Election Results
Election Info
Weblog
Forum
Wiki
Search
Email
Login
Site Info
Store
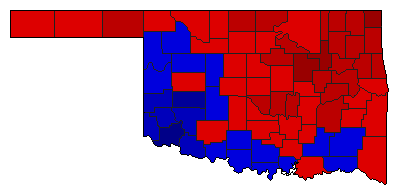
1978 Gubernatorial Democratic Runoff Election Results - Oklahoma
Note: The Google advertisement links below may advocate political positions that this site does not endorse.
Data for this Contest was Contributed by on 2014-07-10
Gubernatorial
Candidate
Political
Party
Popular Vote
George Nigh
Democratic
269,681
57.73%
Larry Derryberry
Democratic
197,457
42.27%
Map Key
> 50%
> 60%
> 70%
> 80%
Turnout
Maps
Pop. (m)
Demographic Data
1980 Population:
3,025,487
Enum.
1980 Population Density:
17.0
persons/km
2
1978 Population:
0
Est.
1978 Population Density:
0.0
persons/km
2
1970 Population:
2,559,463
Enum.
1970 Population Density:
14.4
persons/km
2
Land Area (2000):
177,847
km
2
Annual Pop Growth Rate:
1.7
%
Election Data and Statistics:
County Data (Table)
(m)
County Data (Graphs)
Purchase Detailed Data
Compare State Maps by Year
View All 1978 Oklahoma Maps
Election Tools
Atlas Forum
Image Code for Maps:
County
,
Pop
Data Sources:
Source for Popular Vote data: Oklahoma State Election Board.
Election Results & Statistics 1978
, Oklahoma State Election Board (http://digitalprairie.ok.gov/cdm/compoundobject/collection/stgovpub/id/9947/rec/15) (accessed 10 Jul 2014)
Source for Population data: U.S. Census Bureau.
Results for and Individual County:
(m)
Choose Year
2002
1994
1990
1986
Choose Office
Senator
Lt. Governor
Choose State
Alabama
Florida
Oklahoma Election Results Home
-
National Results for 1978
-
Use Frame Navigation
Login
Terms of Use
-
DCMA Policy
-
Privacy Policy and Cookies
©
Dave Leip's Atlas of U.S. Elections, LLC 2019 All Rights Reserved


