Home
2024
Election Results
Election Info
Weblog
Forum
Wiki
Search
Email
Login
Site Info
Store
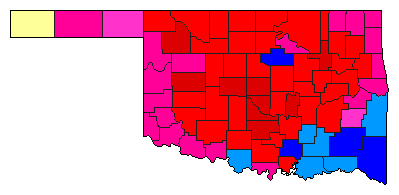
1990 Lt. Gubernatorial Democratic Primary Election Results - Oklahoma
Note: The Google advertisement links below may advocate political positions that this site does not endorse.
Data for this Contest was Contributed by on 2014-07-10
Lt. Gubernatorial
Candidate
Political
Party
Popular Vote
Jack Mildren
Democratic
214,983
44.44%
Jim Davis
Democratic
109,808
22.70%
Huey P. Long
Democratic
50,762
10.49%
Roger Pugh
Democratic
46,848
9.68%
Lee Cate
Democratic
32,846
6.79%
Will Decker
Democratic
28,524
5.90%
Map Key
> 20%
> 30%
> 40%
> 50%
> 60%
Turnout
Maps
Pop. (m)
Demographic Data
1990 Population:
3,145,576
Enum.
1990 Population Density:
17.7
persons/km
2
1980 Population:
3,025,487
Enum.
1980 Population Density:
17.0
persons/km
2
Land Area (2000):
177,847
km
2
Annual Pop Growth Rate:
0.4
%
Election Data and Statistics:
County Data (Table)
(m)
County Data (Graphs)
Purchase Detailed Data
Compare State Maps by Year
View All 1990 Oklahoma Maps
Election Tools
Atlas Forum
Image Code for Maps:
County
,
Pop
Data Sources:
Source for Popular Vote data: Oklahoma State Election Board.
Election Results & Statistics 1990
, Oklahoma State Election Board (http://digitalprairie.ok.gov/cdm/compoundobject/collection/stgovpub/id/9947/rec/15) (accessed 10 Jul 2014)
Source for Population data: U.S. Census Bureau.
Results for and Individual County:
(m)
Choose Year
2006
1994
1986
1982
1978
Choose Office
Senator
Governor
State Treasurer
State Auditor
Choose State
Nebraska
New Mexico
Oklahoma Election Results Home
-
National Results for 1990
-
Use Frame Navigation
Login
Terms of Use
-
DCMA Policy
-
Privacy Policy and Cookies
©
Dave Leip's Atlas of U.S. Elections, LLC 2019 All Rights Reserved


