Home
2024
Election Results
Election Info
Weblog
Forum
Wiki
Search
Email
Login
Site Info
Store
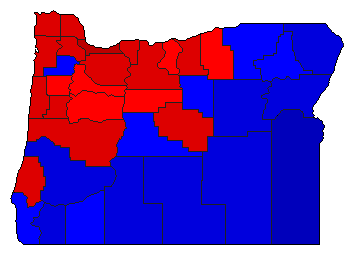
1996 Attorney General General Election Results - Oregon
Note: The Google advertisement links below may advocate political positions that this site does not endorse.
Data for this Contest was Contributed by on 2007-01-08
Attorney General
Candidate
Political
Party
Popular Vote
Hardy Myers
Democratic
658,598
52.68%
Victor Hoffer
Republican
517,035
41.35%
Thomas B. Cox
Libertarian
33,585
2.69%
Michael Allan Campbell
Natural Law
20,553
1.64%
Karl Sorg
Socialist
20,524
1.64%
Map Key
> 40%
> 50%
> 60%
> 70%
Turnout
Maps
Pop. (m)
Demographic Data
2000 Population:
3,421,399
Enum.
2000 Population Density:
13.8
persons/km
2
1996 Population:
3,247,111
Est.
1996 Population Density:
13.1
persons/km
2
1990 Population:
2,842,337
Enum.
1990 Population Density:
11.4
persons/km
2
Land Area (2000):
248,631
km
2
Annual Pop Growth Rate:
1.9
%
Election Data and Statistics:
County Data (Table)
(m)
County Data (Graphs)
Purchase Detailed Data
Compare State Data by Year (Table)
Compare State Data by Year (Graphs)
View All 1996 Oregon Data
Compare State Maps by Year
View All 1996 Oregon Maps
Election Tools
Atlas Forum
Image Code for Maps:
County
,
Pop
Data Sources:
Source for Popular Vote data: Oregon Secretary of State.
November 1996 General Results
, Oregon Secretary of State (http://www.sos.state.or.us/elections/) (accessed 08 Jan 2007)
Source for Population data: U.S. Census Bureau.
Results for and Individual County:
(m)
Choose Year
2020
2016
2012
2008
2004
2000
1992
1988
1984
1980
1976
1972
1968
1964
1960
1956
1952
Choose Office
President
Senator
Secretary of State
State Treasurer
Measure 31
Measure 34
Measure 37
Choose State
Indiana
Missouri
Montana
North Carolina
North Dakota
Utah
Vermont
Washington
Oregon Election Results Home
-
National Results for 1996
-
Use Frame Navigation
Login
Terms of Use
-
DCMA Policy
-
Privacy Policy and Cookies
©
Dave Leip's Atlas of U.S. Elections, LLC 2019 All Rights Reserved


