Home
2024
Election Results
Election Info
Weblog
Forum
Wiki
Search
Email
Login
Site Info
Store
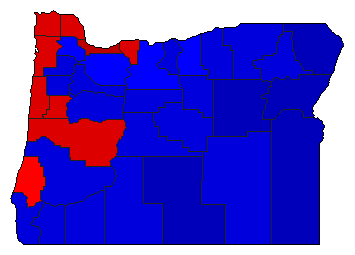
2000 Attorney General General Election Results - Oregon
Note: The Google advertisement links below may advocate political positions that this site does not endorse.
Data for this Contest was Contributed by on 2007-01-08
Attorney General
Candidate
Political
Party
Popular Vote
Hardy Myers
Democratic
715,602
49.86%
Kevin L. Mannix
Republican
662,880
46.19%
Thomas B. Cox
Libertarian
56,611
3.94%
Map Key
> 40%
> 50%
> 60%
> 70%
Turnout
Maps
Demographic Data
2000 Population:
3,421,399
Enum.
2000 Population Density:
13.8
persons/km
2
1990 Population:
2,842,337
Enum.
1990 Population Density:
11.4
persons/km
2
Land Area (2000):
248,631
km
2
Annual Pop Growth Rate:
1.9
%
Election Data and Statistics:
County Data (Table)
(m)
County Data (Graphs)
Purchase Detailed Data
Compare State Data by Year (Table)
Compare State Data by Year (Graphs)
View All 2000 Oregon Data
Compare State Maps by Year
View All 2000 Oregon Maps
Election Tools
Atlas Forum
Image Code for Maps:
County
,
Pop
Data Sources:
Source for Popular Vote data: Oregon Secretary of State.
November 2000 General Results
, Oregon Secretary of State (http://www.sos.state.or.us/elections/) (accessed 08 Jan 2007)
Source for Population data: U.S. Census Bureau.
Results for and Individual County:
Baker County
Benton County
Clackamas County
Clatsop County
Columbia County
Coos County
Crook County
Curry County
Deschutes County
Douglas County
Gilliam County
Grant County
Harney County
Hood River County
Jackson County
Jefferson County
Josephine County
Klamath County
Lake County
Lane County
Lincoln County
Linn County
Malheur County
Marion County
Morrow County
Multnomah County
Polk County
Sherman County
Tillamook County
Umatilla County
Union County
Wallowa County
Wasco County
Washington County
Wheeler County
Yamhill County
Choose Year
2020
2016
2012
2008
2004
1996
1992
1988
1984
1980
1976
1972
1968
1964
1960
1956
1952
Choose Office
President
Secretary of State
State Treasurer
Measure 9
Measure 87
Measure 95
Measure 5
Choose State
Indiana
Missouri
Montana
North Carolina
North Dakota
Pennsylvania
Utah
Vermont
Washington
Oregon Election Results Home
-
National Results for 2000
-
Use Frame Navigation
Login
Terms of Use
-
DCMA Policy
-
Privacy Policy and Cookies
©
Dave Leip's Atlas of U.S. Elections, LLC 2019 All Rights Reserved


