Home
2024
Election Results
Election Info
Weblog
Forum
Wiki
Search
Email
Login
Site Info
Store
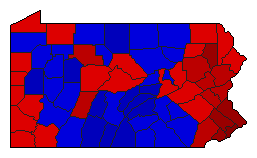
2006 Gubernatorial General Election Results - Pennsylvania
Note: The Google advertisement links below may advocate political positions that this site does not endorse.
Gubernatorial
Candidate
Lt. Gubernatorial
Candidate
Political
Party
Popular Vote
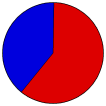
Ed Rendell
Catherine Baker Knoll
Democratic
2,470,517
60.31%
Lynn Swann
Jim Matthews
Republican
1,622,135
39.60%
Write-ins
-
-
3,425
0.08%
Map Key
> 50%
> 60%
> 70%
> 80%
Turnout
Maps
Demographic Data
2010 Population:
12,702,379
Enum.
2010 Population Density:
109.4
persons/km
2
2006 Population:
12,510,809
Est.
2006 Population Density:
107.8
persons/km
2
2000 Population:
12,281,054
Enum.
2000 Population Density:
105.8
persons/km
2
Land Area (2000):
116,074
km
2
Annual Pop Growth Rate:
0.3
%
Election Data and Statistics:
County Data (Table)
(m)
County Data (Graphs)
Voter Registration & Turnout Data
(m)
Purchase Detailed Data
Compare State Data by Year (Table)
Compare State Data by Year (Graphs)
View All 2006 Pennsylvania Data
Compare State Maps by Year
View All 2006 Pennsylvania Maps
Election Tools
Atlas Forum
Image Code for Maps:
County
,
Pop
,
Tnd
,
Swg
Data Sources:
Source for Popular Vote data:
Source for Population data: U.S. Census Bureau.
Results for and Individual County:
Adams County
Allegheny County
Armstrong County
Beaver County
Bedford County
Berks County
Blair County
Bradford County
Bucks County
Butler County
Cambria County
Cameron County
Carbon County
Centre County
Chester County
Clarion County
Clearfield County
Clinton County
Columbia County
Crawford County
Cumberland County
Dauphin County
Delaware County
Elk County
Erie County
Fayette County
Forest County
Franklin County
Fulton County
Greene County
Huntingdon County
Indiana County
Jefferson County
Juniata County
Lackawanna County
Lancaster County
Lawrence County
Lebanon County
Lehigh County
Luzerne County
Lycoming County
McKean County
Mercer County
Mifflin County
Monroe County
Montgomery County
Montour County
Northampton County
Northumberland County
Perry County
Philadelphia County
Pike County
Potter County
Schuylkill County
Snyder County
Somerset County
Sullivan County
Susquehanna County
Tioga County
Union County
Venango County
Warren County
Washington County
Wayne County
Westmoreland County
Wyoming County
York County
The 2006 Campaign:
Pre-Election Polls
< 2002
Choose Year
2022
2018
2014
2010
2002
1998
1994
1990
1986
1982
1978
1974
1970
1966
1962
1958
1954
1950
1946
1942
1938
1934
1930
1926
1922
1918
1914
1910
1906
1902
1898
1894
1890
1886
1882
1878
1863
1860
Choose Office
Senator
Referendum
Choose State
Alabama
Alaska
Arizona
Arkansas
California
Colorado
Connecticut
Florida
Georgia
Hawaii
Idaho
Illinois
Iowa
Kansas
Maine
Maryland
Massachusetts
Michigan
Minnesota
Nebraska
Nevada
New Hampshire
New Mexico
New York
Ohio
Oklahoma
Oregon
Rhode Island
South Carolina
South Dakota
Tennessee
Texas
Vermont
Wisconsin
Wyoming
2010 >
Pennsylvania Election Results Home
-
National Results for 2006
-
Use Frame Navigation
Login
Terms of Use
-
DCMA Policy
-
Privacy Policy and Cookies
©
Dave Leip's Atlas of U.S. Elections, LLC 2019 All Rights Reserved


