| |
Presidential
Candidate | Home State | Political
Party | Primary Vote | Delegates |
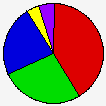
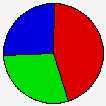
 | John Kerry | Massachusetts | Democratic |
151,527 |
41.02% | 31 | 44.9% |
 | John Edwards | North Carolina | Democratic |
97,914 |
26.51% | 20 | 29.0% |
 | Wesley Clark | Arkansas | Democratic |
85,315 |
23.10% | 18 | 26.1% |
 | Howard Dean | Vermont | Democratic |
16,128 |
4.37% | 0 | 0.0% |
 | Al Sharpton | New York | Democratic |
6,107 |
1.65% | 0 | 0.0% |
| Joe Lieberman | Connecticut | Democratic |
3,213 |
0.87% | 0 | 0.0% |
| Uncommitted | - | Democratic |
2,727 |
0.74% | 0 | 0.0% |
| Carol Moseley-Braun | Illinois | Democratic |
2,490 |
0.67% | 0 | 0.0% |
| Dennis Kucinich | Ohio | Democratic |
2,279 |
0.62% | 0 | 0.0% |
| Richard Gephardt | Missouri | Democratic |
1,402 |
0.38% | 0 | 0.0% |
| Lyndon Larouche, Jr | Virginia | Democratic |
283 |
0.08% | 0 | 0.0% |
 |
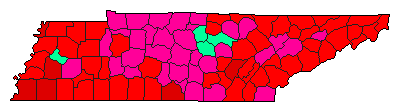
Map Key
| Turnout
 |  |  |
|
|
| | Demographic Data
| 2010 Population: | 6,346,105 | Enum. | 2010 Population Density: | 59.4 | persons/km2 | | 2004 Population: | 5,910,809 | Est. | 2004 Population Density: | 55.4 | persons/km2 | | 2000 Population: | 5,689,283 | Enum. | 2000 Population Density: | 53.3 | persons/km2 | | Total Delegates: | 69 | | Delegates Density: | 85,664 | persons/Del | | Land Area (2000): | 106,752 | km2 | Annual Pop Growth Rate: | 1.1 | % |
| Election Data and Statistics:
| Election Tools
|
|
|
|


