Home
2024
Election Results
Election Info
Weblog
Forum
Wiki
Search
Email
Login
Site Info
Store
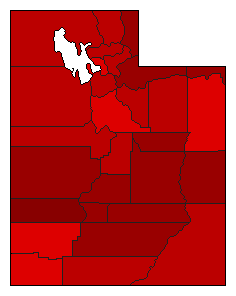
2007 Referendum General Election Results - Utah
Note: The Google advertisement links below may advocate political positions that this site does not endorse.
Data for this Contest was Contributed by on 2007-11-09
* Unofficial Results *
Referendum: House Bill No. 148 entitled "Education Vouchers"
Popular Vote
No
309,528
62.20%
Yes
188,123
37.80%
Map Key
> 50%
> 60%
> 70%
> 80%
Turnout
Maps
Demographic Data
2010 Population:
2,763,885
Enum.
2010 Population Density:
13.0
persons/km
2
2007 Population:
2,597,746
Est.
2007 Population Density:
12.2
persons/km
2
2000 Population:
2,233,169
Enum.
2000 Population Density:
10.5
persons/km
2
Land Area (2000):
212,751
km
2
Annual Pop Growth Rate:
2.2
%
Election Data and Statistics:
County Data (Table)
(m)
County Data (Graphs)
Purchase Detailed Data
Compare State Data by Year (Table)
Compare State Data by Year (Graphs)
View All 2007 Utah Data
Compare State Maps by Year
View All 2007 Utah Maps
Election Tools
Atlas Forum
Image Code for Maps:
County
,
Pop
Data Sources:
Source for Popular Vote data: State of Utah Elections Office.
Propositions and Initiatives, 2007
, State of Utah Elections Office (http://elections.utah.gov/) (accessed 09 Nov 2007)
Source for Population data: U.S. Census Bureau.
Results for and Individual County:
Beaver County
Box Elder County
Cache County
Carbon County
Daggett County
Davis County
Duchesne County
Emery County
Garfield County
Grand County
Iron County
Juab County
Kane County
Millard County
Morgan County
Piute County
Rich County
Salt Lake County
San Juan County
Sanpete County
Sevier County
Summit County
Tooele County
Uintah County
Utah County
Wasatch County
Washington County
Wayne County
Weber County
Choose Year
2008
2008
2008
2008
2008
2004
Choose Office
Choose State
Maine
Maine
New Jersey
New Jersey
New Jersey
New Jersey
Utah Election Results Home
-
National Results for 2007
-
Use Frame Navigation
Login
Terms of Use
-
DCMA Policy
-
Privacy Policy and Cookies
©
Dave Leip's Atlas of U.S. Elections, LLC 2019 All Rights Reserved


