Home
2024
Election Results
Election Info
Weblog
Forum
Wiki
Search
Email
Login
Site Info
Store
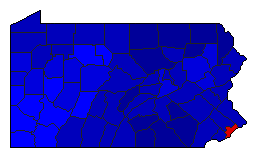
1998 Gubernatorial General Election Results - Pennsylvania
Note: The Google advertisement links below may advocate political positions that this site does not endorse.
Gubernatorial
Candidate
Lt. Gubernatorial
Candidate
Political
Party
Popular Vote
Thomas Ridge
Mark Schwieker
Republican
1,736,844
57.42%
Ivan Itkin
Margorie Margolies-Mezvinsky
Democratic
938,745
31.03%
Peg Luksik
Jim Clymer
Constitutional
315,761
10.44%
Ken Krawchuk
Henry Haller III
Libertarian
33,591
1.11%
Map Key
> 40%
> 50%
> 60%
> 70%
Turnout
Maps
Pop. (m)
Rep. (m)
Dem. (m)
Con. (m)
Swg (m)
Tnd (m)
Demographic Data
2000 Population:
12,281,054
Enum.
2000 Population Density:
105.8
persons/km
2
1998 Population:
12,245,672
Est.
1998 Population Density:
105.5
persons/km
2
1990 Population:
11,882,842
Enum.
1990 Population Density:
102.4
persons/km
2
Land Area (2000):
116,074
km
2
Annual Pop Growth Rate:
0.3
%
Election Data and Statistics:
County Data (Table)
(m)
County Data (Graphs)
Purchase Detailed Data
Compare State Data by Year (Table)
Compare State Data by Year (Graphs)
View All 1998 Pennsylvania Data
Compare State Maps by Year
View All 1998 Pennsylvania Maps
Election Tools
Atlas Forum
Image Code for Maps:
County
,
Pop
,
Tnd
,
Swg
Data Sources:
Source for Popular Vote data: Pennsylvania Department of State. Bureau of Commissions, Elections and Legislation.
X
, Pennsylvania Department of State. Bureau of Commissions, Elections and Legislation ( ) (accessed X)
Source for Population data: U.S. Census Bureau.
Results for and Individual County:
(m)
< 1994
Choose Year
2022
2018
2014
2010
2006
2002
1994
1990
1986
1982
1978
1974
1970
1966
1962
1958
1954
1950
1946
1942
1938
1934
1930
1926
1922
1918
1914
1910
1906
1902
1898
1894
1890
1886
1882
1878
1863
1860
Choose Office
Senator
Choose State
Alabama
Alaska
Arizona
Arkansas
California
Colorado
Connecticut
Florida
Georgia
Hawaii
Idaho
Illinois
Iowa
Kansas
Maine
Maryland
Massachusetts
Michigan
Minnesota
Nebraska
Nevada
New Hampshire
New Mexico
New York
Ohio
Oklahoma
Oregon
Rhode Island
South Carolina
South Dakota
Tennessee
Texas
Vermont
Wisconsin
Wyoming
2002 >
Pennsylvania Election Results Home
-
National Results for 1998
-
Use Frame Navigation
Login
Terms of Use
-
DCMA Policy
-
Privacy Policy and Cookies
©
Dave Leip's Atlas of U.S. Elections, LLC 2019 All Rights Reserved


