Home
2024
Election Results
Election Info
Weblog
Forum
Wiki
Search
Email
Login
Site Info
Store
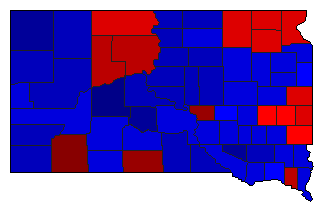
2008 Presidential General Election Results
Note: The Google advertisement links below may advocate political positions that this site does not endorse.
Presidential
Candidate
Vice Presidential
Candidate
Political
Party
Popular Vote
Electoral Vote
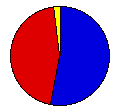
John S. McCain, III
Sarah Palin
Republican
203,054
53.16%
3
Barack H. Obama
Joseph R. Biden, Jr.
Democratic
170,924
44.75%
0
Ralph Nader
Matt Gonzalez
Independent
4,267
1.12%
0
Charles O. Baldwin
Darrell L. Castle
Constitution
1,895
0.50%
0
Bob Barr
Wayne A. Root
Independent
1,835
0.48%
0
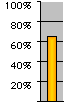
Map Key
> 40%
> 50%
> 60%
> 70%
> 80%
Turnout
Maps
Demographic Data
2010 Population:
814,180
Enum.
2010 Population Density:
4.1
persons/km
2
2008 Population:
799,124
Est.
2008 Population Density:
4.1
persons/km
2
2000 Population:
754,844
Enum.
2000 Population Density:
3.8
persons/km
2
Total Electoral Vote:
3
Electoral Vote Density:
266,375
persons/EV
Land Area (2000):
196,540
km
2
Annual Pop Growth Rate:
0.8
%
Election Data and Statistics:
County Data (Table)
(m)
County Data (Graphs)
Congressional District Data
(m)
Precinct Data
(m)
Precinct Data Search
(m)
Purchase Detailed Data
Compare State Data by Year (Table)
Compare State Data by Year (Graphs)
View All 2008 South Dakota Data
Compare State Maps by Year
View All 2008 South Dakota Maps
South Dakota JavaCompare
(m)
Election Tools
Atlas Forum
Image Code for Maps:
County
,
CD
,
Pop
,
Prc
,
Tnd
,
Swg
Data Sources:
Source for Popular Vote data: South Dakota Secretary of State.
2008 South Dakota Official General Election Results Statewide Races by County November 4, 2008
, South Dakota Secretary of State ( ) (accessed 26 Nov 2008)
Source for Population data: U.S. Census Bureau.
Results for and Individual County:
Aurora County
Beadle County
Bennett County
Bon Homme County
Brookings County
Brown County
Brule County
Buffalo County
Butte County
Campbell County
Charles Mix County
Clark County
Clay County
Codington County
Corson County
Custer County
Davison County
Day County
Deuel County
Dewey County
Douglas County
Edmunds County
Fall River County
Faulk County
Grant County
Gregory County
Haakon County
Hamlin County
Hand County
Hanson County
Harding County
Hughes County
Hutchinson County
Hyde County
Jackson County
Jerauld County
Jones County
Kingsbury County
Lake County
Lawrence County
Lincoln County
Lyman County
McCook County
McPherson County
Marshall County
Meade County
Mellette County
Miner County
Minnehaha County
Moody County
Pennington County
Perkins County
Potter County
Roberts County
Sanborn County
Shannon County
Spink County
Stanley County
Sully County
Todd County
Tripp County
Turner County
Union County
Walworth County
Yankton County
Ziebach County
Primary Documentation:
2008 Certificate of Ascertainment
(m)
2008 Certificate of Vote
(m)
2008 Official County Documents
The 2008 Campaign:
General Election Candidates
Pre-Election Polls
< 2004
Choose Year
2020
2016
2012
2004
2000
1996
1992
1988
1984
1980
1976
1972
1968
1964
1960
1956
1952
1948
1944
1940
1936
1932
1928
1924
1920
1916
1912
1908
1904
1900
1896
1892
Choose Office
Senator
Choose State
Alabama
Alaska
Arizona
Arkansas
California
Colorado
Connecticut
Delaware
District of Columbia
Florida
Georgia
Hawaii
Idaho
Illinois
Indiana
Iowa
Kansas
Kentucky
Louisiana
Maine
Maryland
Massachusetts
Michigan
Minnesota
Mississippi
Missouri
Montana
Nebraska
Nevada
New Hampshire
New Jersey
New Mexico
New York
North Carolina
North Dakota
Ohio
Oklahoma
Oregon
Pennsylvania
Rhode Island
South Carolina
Tennessee
Texas
Utah
Vermont
Virginia
Washington
West Virginia
Wisconsin
Wyoming
2012 >
South Dakota Election Results Home
-
National Results for 2008
-
Use Frame Navigation
Login
Terms of Use
-
DCMA Policy
-
Privacy Policy and Cookies
©
Dave Leip's Atlas of U.S. Elections, LLC 2019 All Rights Reserved


