Note: The Google advertisement links below may advocate political positions that this site does not endorse.
Official Results
  Presidential
Candidate
Vice Presidential
Candidate
Political
Party
Popular VoteElectoral Vote
Willard Mitt RomneyPaul RyanRepublican 689,809 59.59%6
Barack H. ObamaJoseph R. Biden, Jr.Democratic 439,908 38.00%0
Gary JohnsonJames P. GrayLibertarian 20,409 1.76%0
Chuck BaldwinJoseph MartinReform 4,990 0.43%0
YOther (+) - - 2,416 0.21%0
Total Vote 1,157,532
Maps
2012 Presidential General Election - Kansas Election County Map
County H
County Pop H
2008 Button H
Per Vote Republican Button H
Per Vote Democratic Button H
Swing Map Button H
Trend Map Button H
Town H
Last Button H
Per Vote Republican Button H
Per Vote Democratic Button H
Swing Map Button H
Trend Map Button H
County H
 
(Note: click the 'H' buttons above to hold the given map and change the image map)
PerDemocraticRepublicanPie
>20%
 
0
 
 
0
 
pie
>30%
 
0
 
 
0
 
>40%
 
7
 
 
7
 
>50%
 
17
 
 
17
 
>60%
 
1
 
 
1
 
>70%
 
1
 
 
1
 
>80%
 
0
 
 
0
 
>90%
 
0
 
 
0
 
 Election Data and Statistics:
Data Sources:
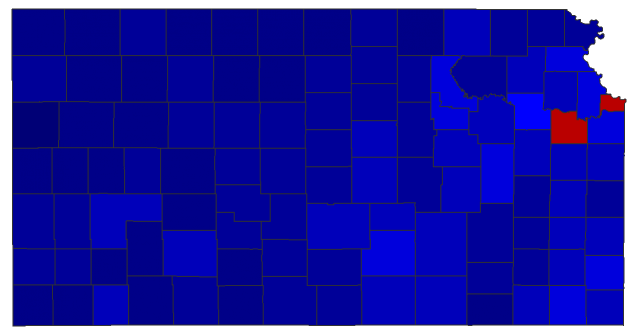
  • Source for Popular Vote data: Kansas Secretary of State. 2012 General Election Results by county, Kansas Secretary of State (http://www.kssos.org/elections/12elec/2012_General_Election_Results_by_County.xlsx ) (accessed 22 Dec 2012)
Election Notes:
  • Vote totals reflect corrected figures in Wilson County - data in official report double-counts the actually tally in Wilson County.


Classic Kansas Results for 2012 - National Results for 2012

Login

Terms of Use - DCMA Policy - Privacy Policy and Cookies


© Dave Leip's Atlas of U.S. Elections, LLC 2019 All Rights Reserved