Note: The Google advertisement links below may advocate political positions that this site does not endorse.
Official Results
  Presidential
Candidate
Vice Presidential
Candidate
Political
Party
Popular VoteElectoral Vote
Barack H. ObamaJoseph R. Biden, Jr.Democratic 1,921,761 60.67%11
Willard Mitt RomneyPaul RyanRepublican 1,188,460 37.52%0
Gary JohnsonJames P. GrayLibertarian 30,931 0.98%0
Jill SteinCheri HonkalaGreen-Rainbow 20,063 0.63%0
Write-ins-- 6,552 0.21%0
Total Vote 3,167,767
Maps
2012 Presidential General Election - Massachusetts Election County Map
County H
County Pop H
2008 Button H
Per Vote Democratic Button H
Per Vote Republican Button H
Swing Map Button H
Trend Map Button H
Town H
Last Button H
Per Vote Democratic Button H
Per Vote Republican Button H
Swing Map Button H
Trend Map Button H
County H
 
(Note: click the 'H' buttons above to hold the given map and change the image map)
PerDemocraticRepublicanPie
>20%
 
0
 
 
0
 
pie
>30%
 
0
 
 
0
 
>40%
 
19
 
 
19
 
>50%
 
111
 
 
111
 
>60%
 
60
 
 
60
 
>70%
 
51
 
 
51
 
>80%
 
15
 
 
15
 
>90%
 
0
 
 
0
 
 Election Data and Statistics:
Data Sources:
  • Source for Popular Vote data: Massachusetts Secretary of the Commonwealth Elections Division. Return of Votes For Massachusetts State Election November 6, 2012, Massachusetts Secretary of the Commonwealth Elections Division (http://ma.electionstats.com/elections/view/22515/ ) (accessed 21 Feb 2013)
Election Notes:
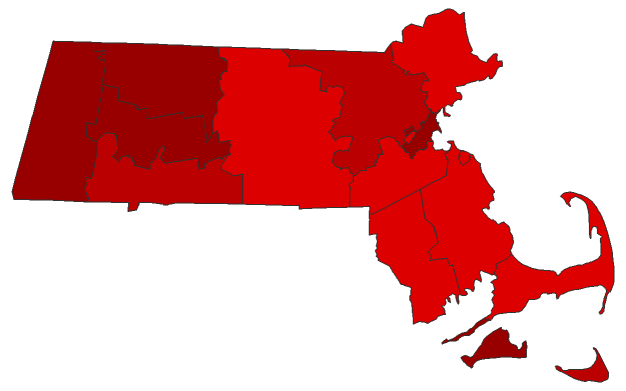
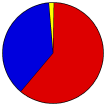
  • Offical Results: Obama 1,921,290, Romney 1,188,314, Stein 20,691, Johnson 30,920. Corrected figures in town of Easton (Bristol County) per Town Clerk


Classic Massachusetts Results for 2012 - National Results for 2012

Login

Terms of Use - DCMA Policy - Privacy Policy and Cookies


© Dave Leip's Atlas of U.S. Elections, LLC 2019 All Rights Reserved