Note: The Google advertisement links below may advocate political positions that this site does not endorse.
Official Results
  Gubernatorial
Candidate
Lt. Gubernatorial
Candidate
Political
Party
Popular Vote
Michelle Lujan GrishamHowie C. MoralesDemocratic 370,168 51.97%
Mark V. RonchettiAnt L. ThorntonRepublican 324,701 45.59%
Karen Evette BedonieEfren Gallardo, Jr.Libertarian 17,387 2.44%
Total Vote 712,256
Maps
2022 Gubernatorial General Election - New Mexico Election County Map
County H
2018 Button H
Per Vote Democratic Button H
Per Vote Republican Button H
Swing Map Button H
Trend Map Button H
 
(Note: click the 'H' buttons above to hold the given map and change the image map)
PerDemocraticRepublicanPie
>20%


pie
>30%


>40%


>50%


>60%


>70%


>80%


>90%


 Election Data and Statistics:
Data Sources:
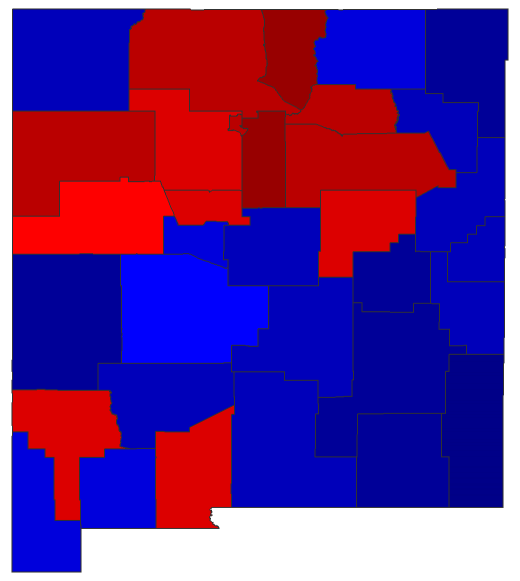
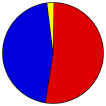
  • Source for Popular Vote data: New Mexico Office of the Secretary of State. Bureau of Elections. Official Results 2022 General November 8, 2022 Governor and Lieutenant Governor, New Mexico Office of the Secretary of State. Bureau of Elections (https://electionresults.sos.state.nm.us/resultsSW.aspx?type=SW&map=CTY) (accessed 2022-11-29)


Classic New Mexico Results for 2022 - National Results for 2022

Login

Terms of Use - DCMA Policy - Privacy Policy and Cookies


© Dave Leip's Atlas of U.S. Elections, LLC 2019 All Rights Reserved