Home
2024
Election Results
Election Info
Weblog
Forum
Wiki
Search
Email
Login
Site Info
Store
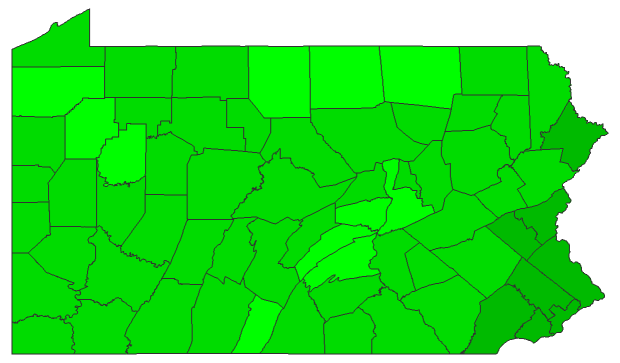
2012 Presidential Republican Primary - Pennsylvania
Note: The Google advertisement links below may advocate political positions that this site does not endorse.
Choose Office
Official Results
Choose State
Alabama Primary
Alaska Caucus
Arizona Primary
Arkansas Primary
California Primary
Colorado Caucus
Colorado
Colorado Convention
Connecticut Primary
Delaware Primary
District of Columbia Primary
Florida Primary
Georgia Primary
Hawaii Caucus
Idaho Caucus
Illinois Primary
Indiana Primary
Iowa Caucus
Kansas Caucus
Kentucky Primary
Louisiana Primary
Maine Caucus
Maryland Primary
Massachusetts Primary
Michigan Primary
Minnesota
Minnesota Convention
Minnesota Caucus
Mississippi Primary
Missouri Caucus
Missouri Primary
Missouri
Montana Primary
Montana Convention
Nebraska Convention
Nebraska Primary
Nevada Caucus
New Hampshire Primary
New Jersey Primary
New Mexico Primary
New York Primary
North Carolina Primary
North Dakota Caucus
Ohio Primary
Oklahoma Primary
Oregon Primary
Pennsylvania Primary
Rhode Island Primary
South Carolina Primary
South Dakota Primary
Tennessee Primary
Texas Primary
Utah Primary
Vermont Primary
Virginia Primary
Washington Caucus
West Virginia Primary
Wisconsin Primary
Wyoming Caucus
Wyoming Convention
Wyoming
American Samoa Caucus
Guam Convention
N. Mariana Isl. Caucus
Puerto Rico Primary
Virgin Islands Caucus
Presidential
Candidate
Home State
Political
Party
Primary Vote
Delegates
Mitt Romney
Massachusetts
Republican
468,374
57.70%
0
0.0%
Rick Santorum
Virginia
Republican
149,056
18.36%
0
0.0%
Ron Paul
Texas
Republican
106,148
13.08%
0
0.0%
Newt Gingrich
Virginia
Republican
84,537
10.41%
0
0.0%
Write-ins
-
Republican
3,511
0.43%
0
0.0%
Other (
+
)
-
Republican
80
0.01%
0
0%
Unallocated
-
Republican
-
-
72
100.0%
Total Vote
811,706
Maps
(Note: click the 'H' buttons above to hold the given map and change the image map)
Per
Gingrich
Romney
Paul
Santorum
Pie
>20%
>30%
>40%
>50%
>60%
>70%
>80%
>90%
Election Data and Statistics:
County Data (Table)
(m)
County Data (Graphs)
Purchase Detailed Data
Compare State Maps by Year
View All 2012 Pennsylvania Maps
Data Sources:
Source for Popular Vote data:
Choose Year
2024
2016
2016 >
Classic Pennsylvania Results for 2012
-
National Results for 2012
Login
Terms of Use
-
DCMA Policy
-
Privacy Policy and Cookies
©
Dave Leip's Atlas of U.S. Elections, LLC 2019 All Rights Reserved